
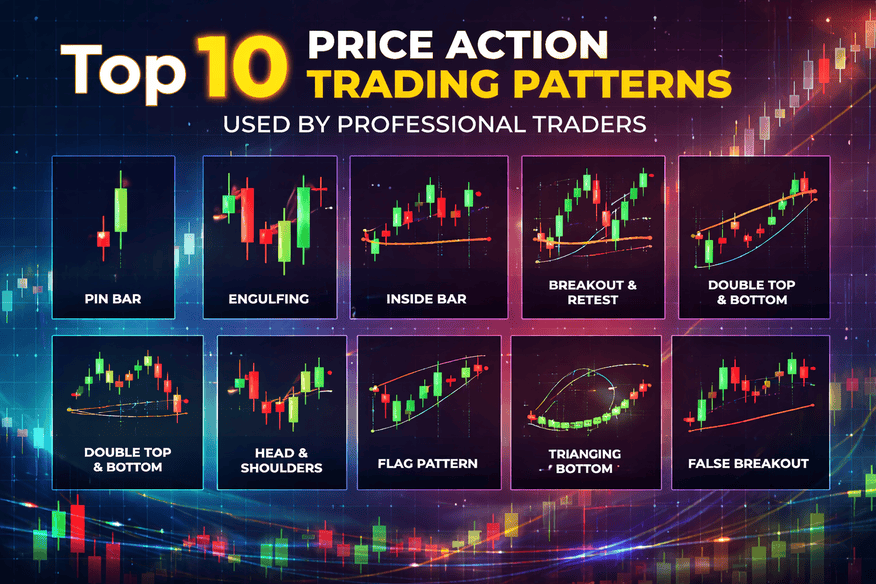
Price action trading remains one of the most respected approaches in the financial markets because it focuses on what price is actually doing rather than relying only on lagging indicators. Professional traders often study raw price movement to understand the balance between buyers and sellers, identify momentum shifts, and make better trading decisions in stocks, forex, commodities, and indices. While indicators can sometimes help confirm a view, many experienced traders trust price action because it reflects the real-time psychology of the market.
In simple words, price action trading means reading charts by observing candlestick structures, support and resistance zones, trend behavior, volatility, and recurring market patterns. These patterns are not magical formulas. They work because traders across the world react similarly to fear, greed, uncertainty, and opportunity. When the same emotional behavior repeats, similar chart structures appear again and again.
For WordPress users creating educational finance content, price action is a powerful topic because it attracts beginners, intermediate traders, and even experienced investors who want to improve timing. A well-written guide on price action trading patterns can help readers understand not just what a pattern looks like, but why it forms and how professionals interpret it.
In this detailed article, we will explore the top 10 price action trading patterns used by professional traders. Each pattern has its own logic, market context, and trading significance. The real edge comes from understanding how and when to use them rather than memorizing names alone.
Why Professional Traders Prefer Price Action Trading
Professional traders often prefer price action because it strips the chart down to its most important element: price itself. Indicators are derived from price, which means they usually come after the move has already begun. Price action, on the other hand, gives direct insight into momentum, trend continuation, reversals, and key market reaction zones.
Another reason professionals use price action is flexibility. A moving average setup may work well in a trending market and fail badly in a range-bound environment. Price action patterns can be applied more naturally because they tell a story about the market. A long rejection wick at resistance, for example, sends a different message from a strong bullish breakout candle above a consolidation range.
Professional traders also know that patterns do not exist in isolation. A candlestick pattern near a major demand zone carries far more meaning than the same candle in the middle of random chart noise. Context matters. This is why experienced market participants combine patterns with location, trend direction, liquidity, and market structure.
Find Your Price Action Trading Pattern
Select the market condition below and discover which price action pattern traders often watch.
What Makes a Price Action Pattern Reliable
A reliable price action pattern is not just about shape. It becomes useful when it appears at an important location and aligns with the broader chart structure. For example, a bullish engulfing candle forming after a long decline and near a major support zone is more significant than the same pattern appearing in the middle of a weak sideways range.
Volume can also add conviction, especially in stock market trading. If a breakout pattern is supported by above-average volume, it suggests genuine interest from buyers or sellers. Timeframe is another important factor. Patterns on higher timeframes such as daily and weekly charts usually carry more weight than patterns on very small intraday charts because they reflect a broader pool of market activity.
Professional traders do not treat every pattern as a signal to enter blindly. They look for confirmation, risk-reward balance, and invalidation points. That disciplined approach separates consistent traders from impulsive ones.
Pattern One: The Pin Bar
The pin bar is one of the most popular price action patterns in trading. It is easy to identify and widely used by professionals. A pin bar has a small real body and a long wick on one side, showing strong rejection of a price level. If the long wick is below the body, it may signal bullish rejection. If the long wick is above the body, it may indicate bearish rejection.
This pattern reflects a failed attempt by one side of the market. For example, in a bullish pin bar, sellers push price lower, but buyers step in aggressively and force the close back up. This tells traders that demand may be entering the market.
The pin bar works best when it forms near strong support or resistance, trendlines, moving dynamic levels, or after a pullback within a trend. A bullish pin bar in an uptrend is often seen as a continuation opportunity, while a bearish pin bar at a major resistance level may hint at a reversal.
Professional traders rarely trade a pin bar without context. They want to see whether it forms at a meaningful zone and whether the next candle confirms the rejection.
Pattern Two: The Engulfing Candle Pattern
The engulfing pattern is another major price action signal used by professional traders. It occurs when one candle fully engulfs the real body of the previous candle. In a bullish engulfing pattern, a strong upward candle wraps around the previous bearish candle. In a bearish engulfing pattern, a strong downward candle covers the previous bullish candle.
This pattern signals a sudden shift in market control. A bullish engulfing candle suggests buyers have overwhelmed sellers. A bearish engulfing candle suggests sellers have taken charge after buyers lost momentum.
The engulfing pattern becomes especially powerful at turning points. A bullish engulfing candle near support after a decline may indicate accumulation. A bearish engulfing candle near resistance after a rally may signal distribution. It is also effective after a pullback in a strong trend, where it can serve as a continuation entry trigger.
Professionals pay close attention to the size of the engulfing candle. A large candle with a decisive close usually carries more meaning than a small, weak engulfing structure.
Pattern Three: The Inside Bar
The inside bar is a classic pattern that represents consolidation and indecision. It forms when the high and low of one candle stay completely within the range of the previous candle. The first candle is often called the mother bar, while the second is the inside bar.
This pattern suggests the market is temporarily pausing. Buyers and sellers are balancing out, and the next breakout from the pattern can lead to a strong move. Professional traders often use inside bars in trending markets as continuation setups. For example, if a stock is in an uptrend and forms an inside bar after a bullish impulse, a breakout above the mother bar can signal the next leg higher.
The inside bar can also appear before reversals, especially when it forms at key resistance or support. However, in that case, traders usually wait for a clear breakout direction before committing.
What makes the inside bar attractive is its clean risk structure. Since the pattern is compact, stop-loss placement can be tighter relative to the potential move.
Pattern Four: The Breakout and Retest Pattern
The breakout and retest pattern is widely used by professional traders because it combines momentum with confirmation. A breakout occurs when price moves decisively above resistance or below support. But instead of entering immediately on the breakout, many traders wait for price to return and retest the broken zone.
If old resistance becomes new support, and price holds that level before rising again, it often confirms the breakout. The same logic applies in reverse for bearish setups, where old support becomes new resistance.
This pattern helps reduce false entries. Many breakouts fail because price briefly moves beyond a level and then reverses sharply. The retest allows traders to assess whether the market truly accepts the new price zone.
Professionals like this setup because it shows both intent and validation. First, the market proves it can break a level. Then it proves it can defend that level on retest. That combination often leads to cleaner entries with better trade structure.
Pattern Five: The Double Top and Double Bottom
The double top and double bottom are classic reversal patterns that remain highly relevant in modern trading. A double top forms when price tests a resistance area twice and fails both times, often leading to a bearish reversal. A double bottom forms when price tests a support area twice and holds, often leading to a bullish reversal.
These patterns reflect exhaustion and repeated rejection. In a double top, buyers fail to push beyond resistance despite two attempts. In a double bottom, sellers fail to break support even after returning to it.
The neckline is important in both patterns. In a double top, confirmation usually comes when price breaks below the low between the two peaks. In a double bottom, confirmation usually comes when price breaks above the high between the two lows.
Professional traders avoid assuming the reversal before confirmation. A market can test the same level twice and still break through on the third attempt. Patience is essential.
Pattern Six: The Head and Shoulders Pattern
The head and shoulders pattern is one of the most recognized chart patterns in technical analysis. It usually appears at the end of an uptrend and signals a potential bearish reversal. The structure includes a left shoulder, a higher high called the head, and a lower high called the right shoulder. The neckline connects the swing lows between these points.
When price breaks below the neckline, the reversal becomes more credible. The opposite version, called the inverse head and shoulders, forms after a downtrend and signals a potential bullish reversal.
This pattern reflects a weakening trend. In a normal head and shoulders, buyers push to a new high at the head, but fail to maintain strength. The right shoulder shows reduced bullish power, and the neckline break confirms that sellers may be taking over.
Professional traders appreciate this pattern because it provides a clear structure, logical invalidation, and measurable target potential. Still, they understand that not every head and shoulders is clean. Slight variations are common, so flexibility and chart reading skill matter.
Pattern Seven: The Flag Pattern
The flag pattern is a strong continuation pattern used by traders in trending markets. It usually begins with a sharp impulsive move known as the flagpole. After that move, price enters a small consolidation channel that slopes slightly against the main trend. Once price breaks out of the channel, the trend often resumes.
A bullish flag forms after a strong upward move, followed by a mild downward or sideways pullback. A bearish flag forms after a sharp decline, followed by a temporary upward or sideways pause.
Flags are popular because they represent healthy consolidation rather than weakness. The market pauses, absorbs profits, and then continues in the original direction. Professionals often look for lower volatility inside the flag and stronger momentum on the breakout.
The best flag patterns appear in strong trends and not in messy, sideways conditions. A weak breakout from a flag without momentum often fails, so confirmation remains important.
Pattern Eight: The Triangle Pattern
Triangles are common price action formations that show tightening price behavior. They usually appear before an expansion move. There are different types, including ascending triangles, descending triangles, and symmetrical triangles.
An ascending triangle often signals bullish pressure because price keeps making higher lows while facing a flat resistance line. This suggests buyers are becoming more aggressive. A descending triangle often signals bearish pressure because price keeps making lower highs while support stays flat. A symmetrical triangle shows compression from both sides and can break in either direction.
Professional traders use triangles to prepare for breakout opportunities. The key is not to assume direction too early. Instead, they wait for a confirmed breakout and then assess whether the move has volume and follow-through.
Triangles also teach an important lesson about volatility. As the pattern tightens, the market stores energy. Once that energy releases, the move can be fast and powerful.
Pattern Nine: The Rounding Bottom
The rounding bottom is a gradual reversal pattern that often appears after an extended decline. Unlike a sudden V-shaped reversal, a rounding bottom forms slowly as selling pressure fades and buyers begin to step in over time. The chart takes on a curved appearance, showing a transition from weakness to strength.
This pattern is often seen in longer-term stock market charts. It can represent accumulation, where stronger hands slowly buy while the broader market remains doubtful. When price finally breaks above the resistance of the rounding structure, a meaningful uptrend can begin.
Professional traders value the rounding bottom because it often reflects a deep change in sentiment. However, they also know it requires patience. This is not a fast pattern. It develops over weeks or months, especially on higher timeframes.
The most reliable rounding bottoms occur with improving volume and a clean breakout above the prior resistance zone.
Pattern Ten: The False Breakout Pattern
The false breakout is a favorite concept among advanced traders because it often traps impatient participants. A false breakout happens when price moves above resistance or below support, attracts breakout traders, and then reverses sharply back into the prior range.
This pattern reveals that the breakout lacked real conviction. Sometimes large market participants push price beyond obvious levels to trigger stop-losses and create liquidity before reversing direction. While beginners often get caught in these traps, professionals actively look for them.
A false breakout above resistance that quickly falls back below the level can be a bearish signal. A false breakdown below support that reclaims the level can be a bullish signal. The speed of rejection matters. A sharp rejection suggests the market did not accept the breakout area.
Trading false breakouts requires discipline because the timing can be tricky. Yet when identified properly, they can offer excellent risk-reward setups because the invalidation level is usually clear.
How Professionals Combine These Patterns with Market Context
Professional traders do not build strategies around pattern names alone. They study where the pattern appears, what the broader trend is, and whether volume, momentum, or volatility support the setup. A bullish engulfing candle near major weekly support means something very different from the same candle inside random intraday noise.
Many professionals start with higher timeframe analysis. They identify key zones on the daily or weekly chart, then use lower timeframes for precise execution. This top-down approach helps filter weak setups and focus on trades with stronger structure.
Risk management is equally important. Even the best price action pattern can fail because markets are uncertain by nature. Professionals accept this reality and manage their downside carefully. They define stop-loss levels, position size properly, and never assume a pattern must work.
Common Mistakes Traders Make with Price Action Patterns
One common mistake is trading every visible pattern without considering context. Not every pin bar or inside bar deserves attention. Another mistake is entering too early before confirmation. Many traders anticipate a breakout or reversal before the chart has actually proven it.
Overtrading is another problem. Because price patterns appear frequently, beginners often feel the need to trade constantly. Professionals are more selective. They wait for high-quality setups in strong locations.
Another major error is ignoring market conditions. A continuation pattern works better in a strong trend. A reversal pattern has a better chance near exhaustion zones. Matching the pattern to the environment is critical.
Final Thoughts on Price Action Trading Patterns
The top 10 price action trading patterns used by professional traders continue to matter because they reflect recurring human behavior in the market. The pin bar, engulfing candle, inside bar, breakout and retest, double top, double bottom, head and shoulders, flag, triangle, rounding bottom, and false breakout all offer valuable insights into price behavior. Yet their real power lies in how they are interpreted within trend, support and resistance, volume, and market psychology.
Price action trading is not about prediction in the absolute sense. It is about reading probability, understanding risk, and reacting intelligently to what the market reveals. That is why professionals trust it. They do not trade patterns mechanically. They trade context, structure, and confirmation.