
The SPX500 Forecast
The SPX 500, also known as the SPX500, is a crucial benchmark for the U.S. stock market and the global economy. It comprises 500 of the largest publicly traded companies in the U.S. and serves as a barometer for the overall health of the stock market. This article provides a detailed history of the SPX 500, live trading signals, and forecasts for 2024, tomorrow, the next week, the next 5 years, and the next 10 years.
Understanding the SPX500: A Comprehensive Overview
The SPX500, more commonly known as the S&P 500, stands as a pivotal stock market index encompassing 500 of the largest publicly traded companies in the United States. It serves as a critical benchmark for assessing the health and performance of the U.S. stock market and, by extension, the broader economy. This article provides a detailed exploration of the SPX500, delving into its historical context, current status, and future outlook.
What is the SPX500?
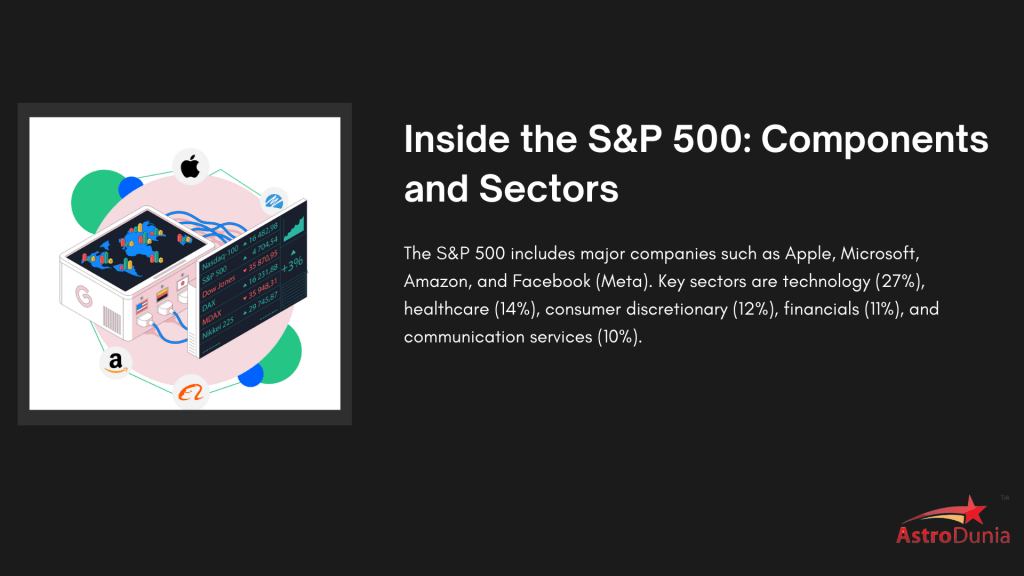
The SPX500, or S&P 500, is an index managed by Standard & Poor’s, designed to reflect the performance of 500 prominent companies across various sectors. This index includes a diverse range of industries, making it a comprehensive gauge of the U.S. economic landscape.
Composition and Calculation
The S&P 500 is a market-capitalization-weighted index, meaning that the size of each company’s contribution to the index is proportional to its market capitalization. The index is calculated by taking the weighted average of the market capitalizations of its constituent companies. This method ensures that larger companies have a more significant impact on the index’s performance than smaller ones.
The index is adjusted quarterly to ensure it accurately represents the current economic and market conditions. Selection criteria for the index include a company’s market capitalization, liquidity, and sector representation, ensuring a balanced and representative index.
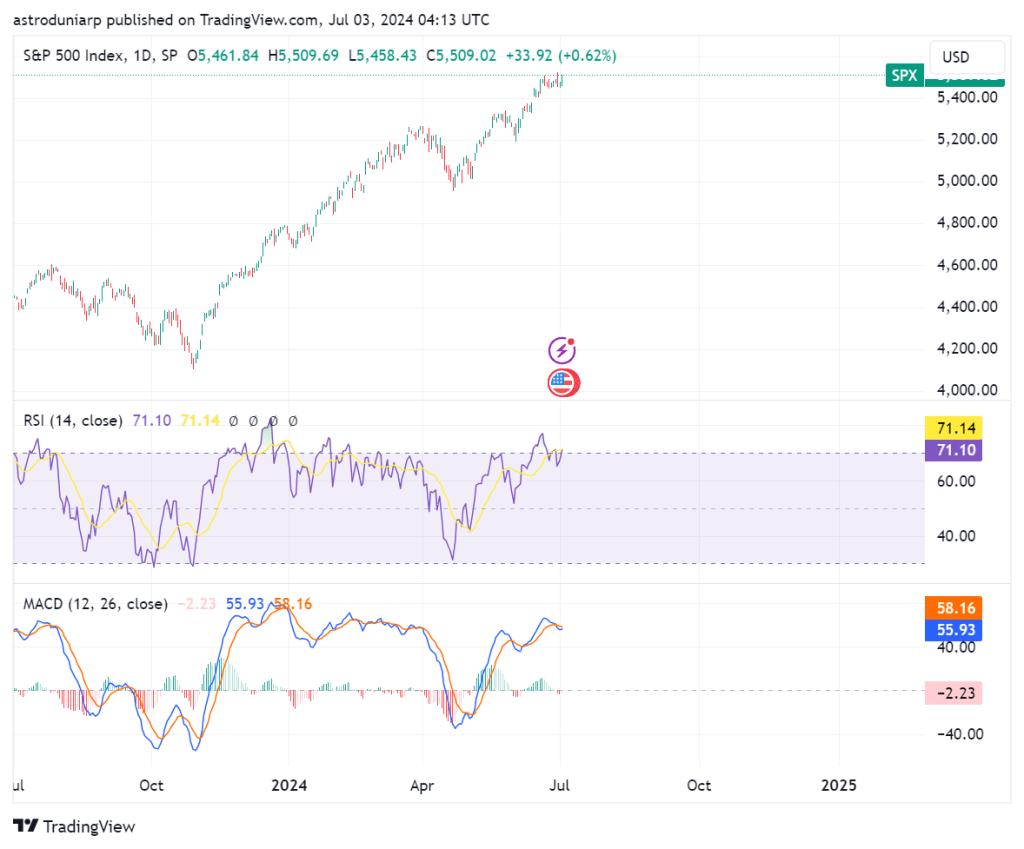
Live SPX500 Chart
This section displays the advanced live chart of SPX 500/ US 500/ S&P 500 Cash from TradingView with ‘1D’ intervals.
Historical Performance
Since its inception in 1957, the S&P 500 has become a cornerstone of financial markets, widely recognized for its role in tracking economic trends. Its performance over the decades highlights the resilience and dynamism of the U.S. stock market.
Milestones and Trends
- 1960s-1970s: During the 1960s, the S&P 500 experienced steady growth, reflecting a period of economic expansion. The 1970s, however, presented challenges, including high inflation and economic instability, which led to periods of volatility.
- 1980s-1990s: The 1980s and 1990s were characterized by significant growth, driven by technological advancements, deregulation, and a robust economy. The bull market of the 1990s saw the S&P 500 reaching new heights, bolstered by the tech boom and economic prosperity.
- 2000s: The early 2000s were marked by the bursting of the dot-com bubble and the 2008 financial crisis, both of which led to substantial declines in the index. Despite these setbacks, the S&P 500 demonstrated resilience and began a recovery phase.
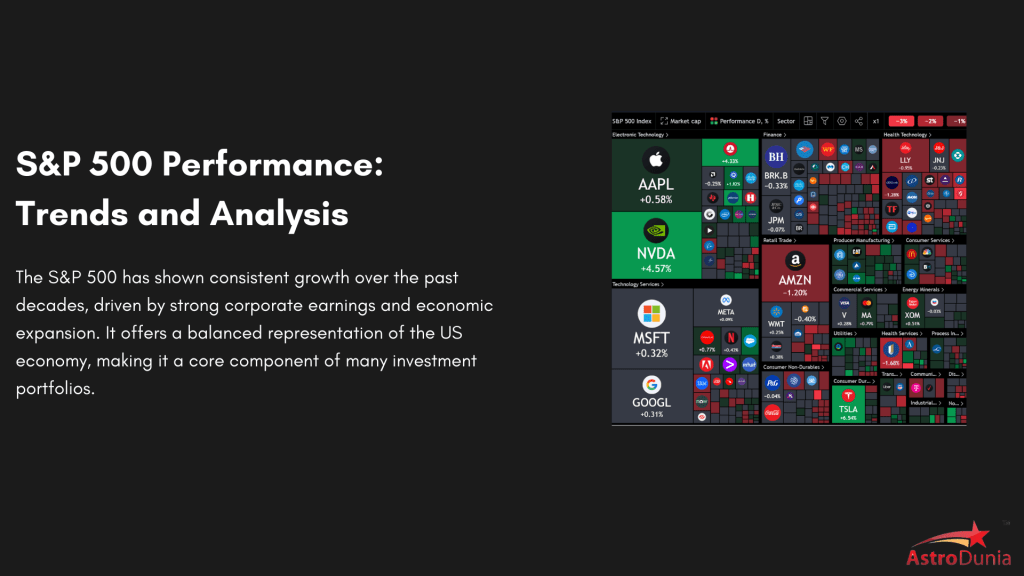
- 2010s-Present: The past decade has seen remarkable growth, with the S&P 500 frequently reaching record highs. This period has been driven by technological innovation, strong corporate earnings, and a recovering economy following the Great Recession.
Current Performance
The SPX500 remains a key indicator of market performance. As of the latest updates, the index continues to show robust performance, reflecting broader economic trends and market dynamics.
Influencing Factors
Global Events: International developments, including geopolitical tensions and global economic conditions, can affect the S&P 500. Events such as trade disputes or economic slowdowns abroad may lead to increased market volatility.
Economic Data: The index’s performance is closely tied to economic indicators such as GDP growth, unemployment rates, and inflation. Positive economic data generally supports a higher index level, while adverse data can lead to market fluctuations.
Corporate Earnings: The financial health of the companies within the S&P 500 significantly impacts the index. Strong earnings reports contribute to higher stock prices and, consequently, a higher index value.
Monetary Policy: The Federal Reserve’s policies, including interest rate adjustments and quantitative easing, play a crucial role in influencing the SPX500. Lower interest rates tend to foster higher stock prices by making borrowing cheaper and encouraging investment.
History of the SPX500
The SPX 500 was created in 1957 by Standard & Poor’s, a financial services company. It was designed to replace the earlier SPX 90, which had been in use since 1923. The SPX 500 quickly became the preferred index for institutional investors due to its broad coverage and market capitalization-weighted structure, which better reflects the economic realities of the U.S. market.
The index includes companies from all sectors of the economy, making it a comprehensive indicator of market performance. Companies are selected based on market capitalization, liquidity, and sector representation. The SPX 500 is widely used by investors as a benchmark for mutual funds, exchange-traded funds (ETFs), and other investment products.
SPX500 Forecast for 2024
Factors such as corporate earnings, interest rates, and global economic conditions will play significant roles. Investors should look for sectors poised for growth, such as technology, healthcare, and renewable energy. Want to stay long-term in the market? Join our Annual Letter now to make informed decisions. For traders, we offer a live signals to help you make real-time informed decisions. Join now to stay ahead in the market.
SPX500 Forecast for Tomorrow
Daily forecasts for the S&P 500 are based on technical analysis, market sentiment, and macroeconomic indicators. For tomorrow’s forecast, traders should monitor key economic data releases, corporate earnings reports, and geopolitical events that could influence market sentiment. Get your daily dose of market insights and updates delivered straight to your inbox. Try our Daily Newsletter.
SPX 500 Forecast for the Next 10 Years
Long-term forecasts for the S&P 500 involve assessing economic trends, technological innovation, and demographic changes. Over the next 10 years, the index is expected to benefit from advancements in artificial intelligence, biotechnology, and green energy. Additionally, shifts in consumer behavior and global trade dynamics will shape the market landscape. Want to stay long-term in the market? Subscribe Annual Letter now to make informed decisions.
US500 Forecast for Today
The US500, another name for the S&P 500, is influenced by various factors on a daily basis. Today’s forecast involves analyzing pre-market indicators, global market performance, and key economic data releases. Investors should keep an eye on interest rate decisions, inflation data, and major corporate announcements. we offer a live signals to help you make real-time informed decisions. Join now to stay ahead in the market.
SPX 500 Forecast for Next Week
Weekly forecasts involve a combination of technical analysis and macroeconomic factors. For the upcoming week, look for trends in trading volumes, moving averages, and key support and resistance levels. Economic events, such as employment reports and Federal Reserve meetings, will also impact the market. Get your daily dose of market insights and updates delivered straight to your inbox. Try our Daily Newsletter service.
SPX 500 Technical Analysis Today
Technical analysis is crucial for short-term trading strategies. Today’s analysis of the S&P 500 should include examining chart patterns, RSI (Relative Strength Index), MACD (Moving Average Convergence Divergence), and Fibonacci retracement levels. These tools help identify potential entry and exit points for traders. Join Live signals service for real time market insights and signals.
SPX 500 Forecast for the Next 5 Years
Medium-term forecasts consider economic cycles, fiscal policies, and technological trends. Over the next five years, the S&P 500 is expected to see growth driven by innovation in technology and healthcare, increased consumer spending, and supportive fiscal policies. However, potential risks include geopolitical tensions, regulatory changes, and market volatility. Want to stay long-term in the market?
Live market alerts on SPX500 and US Market
Stay ahead in the stock market with our comprehensive market alerts and live signals service. For More Information , you can contact us – +91 9669919000
SPX 500 index 1-year historical chart
Top 20 Stocks in SPX500
Discover the leading stocks in the SPX500 index. Click on the links below to access detailed information and insights about each stock’s performance, trends, and forecasts.
Investing in the SPX500
Investors seeking exposure to the SPX500 have several options:
- Exchange-Traded Funds (ETFs): ETFs such as the SPDR S&P 500 ETF (SPY) and the Vanguard S&P 500 ETF (VOO) are designed to track the performance of the S&P 500. These funds provide a convenient way for investors to gain broad exposure to the index.
- Mutual Funds: Index mutual funds that mirror the S&P 500 offer another investment avenue. These funds aim to replicate the performance of the index by holding the same stocks in similar proportions.
- Futures and Options: Advanced investors may use futures and options contracts based on the S&P 500 to hedge their portfolios or speculate on future movements. These instruments provide a way to leverage movements in the index.
Future Outlook
Forecasting the future performance of the SPX500 involves analyzing various factors and trends:
Monetary Policy: Future actions by the Federal Reserve will continue to play a vital role. Changes in interest rates or monetary policy measures can influence market sentiment and the performance of the index.
Economic Forecasts: Analysts examine economic forecasts, including predictions for GDP growth and inflation, to estimate the index’s future performance. A strong economy typically supports higher stock prices and index levels.
Technological Innovations: The impact of technological advancements on companies within the S&P 500 is significant. Sectors such as technology and healthcare are expected to drive future growth, influencing the overall performance of the index.
Geopolitical Risks: Potential risks arising from geopolitical events and global uncertainties can affect market performance. Investors need to stay informed about global developments and their potential impact on the S&P 500.
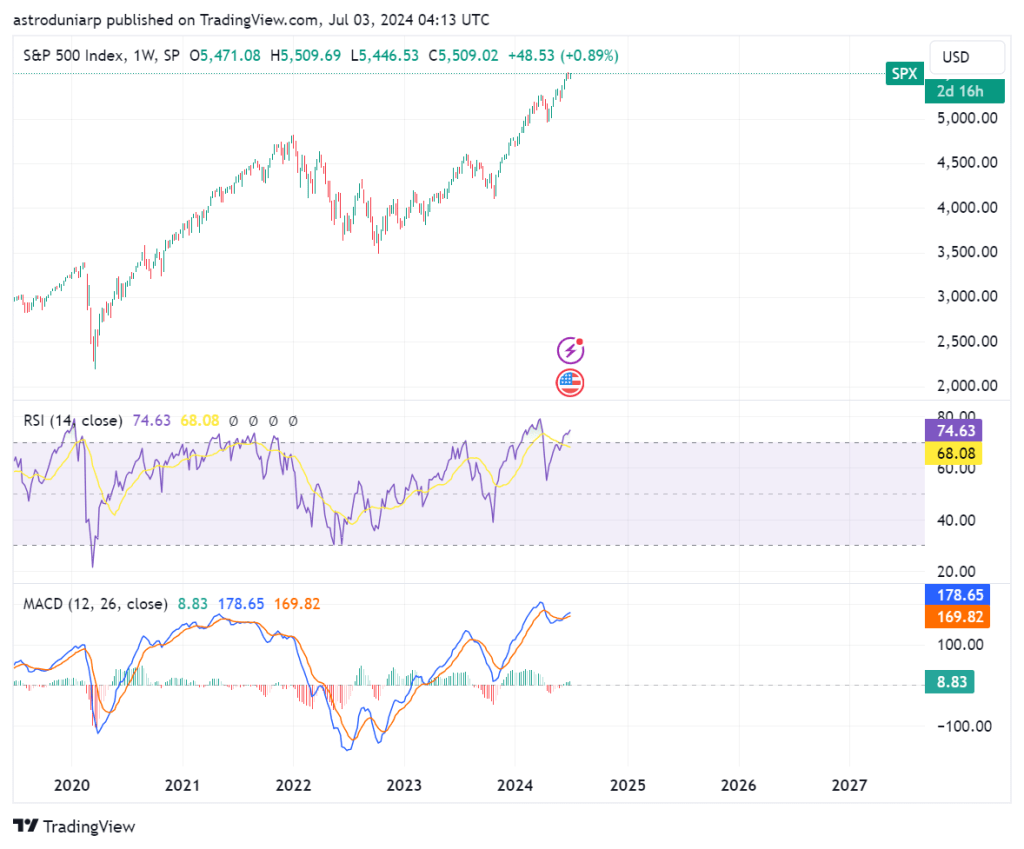
SPX 500 index 5-year historical chart
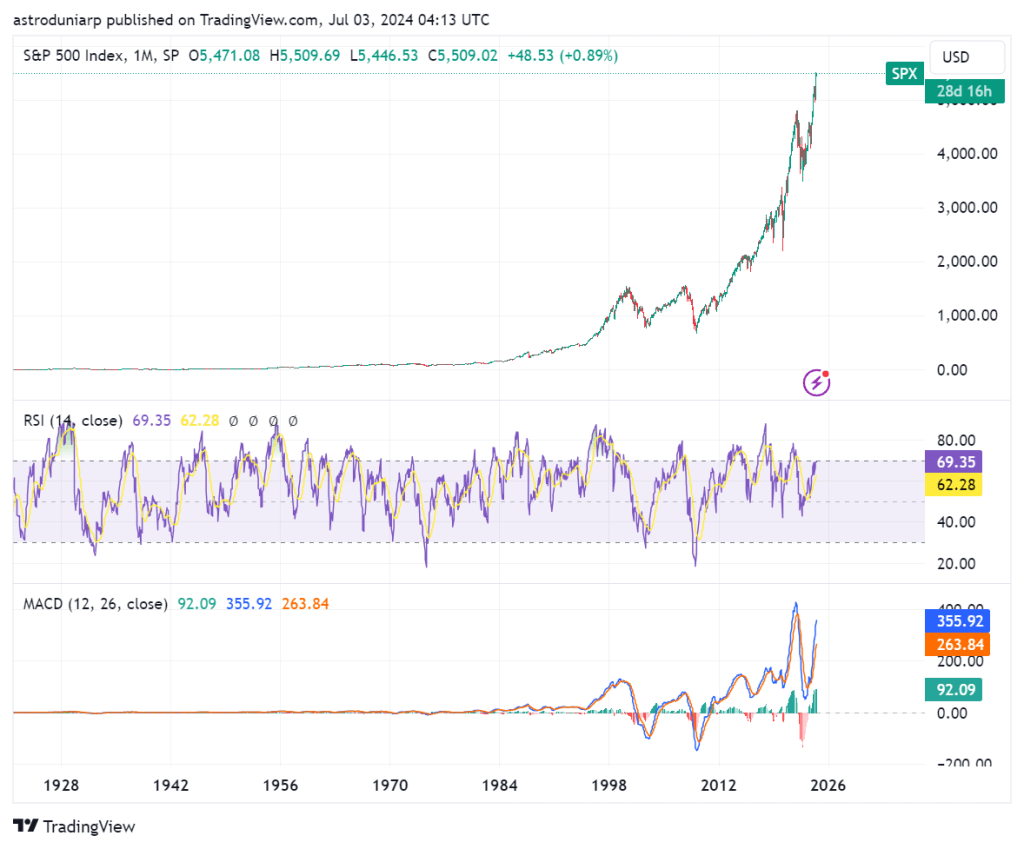
SPX 500 index All time historical chart
S&P 500 Index (SPX500)
The S&P 500 Index (SPX500) is a market-capitalization-weighted index of 500 of the largest publicly traded companies in the U.S.
| No. | ETF Name | Symbol |
| 1. | SPDR S&P 500 ETF Trust | SPY |
| 2. | iShares Core S&P 500 ETF | IVV |
| 3. | Vanguard S&P 500 ETF | VOO |
| 4. | Schwab S&P 500 Index Fund | SWPPX |
| 5. | Invesco S&P 500 Equal Weight ETF | RSP |
| 6. | Fidelity 500 Index Fund | FXAIX |
| 7. | SPDR Portfolio S&P 500 ETF | SPLG |
| 8. | iShares S&P 500 Growth ETF | IVW |
| 9. | iShares S&P 500 Value ETF | IVE |
| 10. | ProShares Ultra S&P 500 | SSO |
Conclusion
The SPX500 remains a cornerstone of financial markets and a critical indicator of the U.S. economic health. Its historical performance reflects both resilience and growth, while current trends indicate continued strength. Investors considering engagement with the SPX500 should stay informed about economic indicators, corporate earnings, and global events to make well-informed decisions. By understanding the key drivers of the index and its historical context, investors can navigate the financial landscape more effectively and make strategic investment choices.
Whether you’re a seasoned investor or just starting out, our financial astrology tools can be tailored to your specific investment goals. Gain valuable insights to achieve your financial aspirations.
Address
1301, 13th Floor, Skye Corporate Park, Near Satya Sai Square, AB Road, Indore 452010
+91 9669919000
© All Rights Reserved by RajeevPrakash.com (Managed by AstroQ AI Private Limited) – 2026