Your cart is currently empty!


The DOW Forecast
The Dow Jones Industrial Average (DJIA), commonly referred to as the Dow, is one of the most recognized stock market indices in the world. Comprising 30 significant publicly traded companies in the United States, the Dow serves as a vital indicator of the market’s health and overall economic conditions. This article explores the history of the Dow, provides live trading signals, and offers forecasts for 2024, tomorrow, next week, the next 5 years, and the next 10 years.
Overview of the Dow Jones Industrial Average (DJIA)
The Dow Jones Industrial Average (DJIA), or simply the Dow, is a premier stock market index that tracks the performance of 30 large, publicly traded companies in the United States. Serving as a crucial indicator of the U.S. stock market’s health, the Dow provides valuable insights into the broader economic landscape.
History of the Dow Jones
The Dow Jones Industrial Average was introduced on May 26, 1896, by Charles Dow, co-founder of Dow Jones & Company, and Edward Jones. Originally, the index consisted of 12 industrial companies, which included notable names such as General Electric and U.S. Steel. The initial purpose of the Dow was to provide a simple measure of the industrial sector’s performance, capturing the economic activities of the time.
Over the decades, the Dow evolved to include a broader range of industries, reflecting the shifting focus of the U.S. economy. By 1928, the index expanded to 30 companies, a number that has remained constant, although the specific companies included have changed over time. This expansion aimed to better represent the diverse nature of the American economy and to provide a more accurate gauge of market performance.
Throughout its history, the Dow has experienced several significant events that have shaped its trajectory. The market crash of 1929, which marked the beginning of the Great Depression, led to a dramatic decline in the Dow, illustrating the vulnerabilities of financial markets during economic crises. Conversely, the post-World War II era saw the Dow flourish, driven by industrial growth and technological advancements.
The tech boom of the late 1990s and early 2000s propelled the Dow to new heights, only to be followed by the burst of the dot-com bubble. The 2008 financial crisis, precipitated by the collapse of major financial institutions, caused another steep decline in the Dow. Despite these setbacks, the index has consistently demonstrated its ability to recover and adapt to changing economic conditions.
Live Dow Chart
This section displays the advanced live chart of Dow( Dow Jones Industrial Average Index) from TradingView.
Current Status of the Dow Jones
In 2024, the Dow Jones Industrial Average continues to be a key indicator of U.S. economic performance. Comprising 30 of the largest and most influential publicly traded companies, the Dow encompasses a diverse array of sectors, including technology, finance, healthcare, consumer goods, and industrials. This diversity helps the index provide a comprehensive snapshot of the American economy.
The current market environment for the Dow is influenced by a range of factors, including macroeconomic data, corporate earnings, and geopolitical developments. Recent trends show that the Dow has managed to navigate the complexities of a post-pandemic economy, with fluctuations driven by inflationary pressures, interest rate adjustments, and global economic uncertainties.
Key components of the Dow, such as Apple Inc., Microsoft Corp., and Johnson & Johnson, play a significant role in shaping the index’s performance. These companies are leaders in their respective fields and have a substantial impact on the Dow’s movements. Additionally, the Federal Reserve’s monetary policy decisions, including interest rate changes and quantitative easing measures, affect investor sentiment and market dynamics.
Investor sentiment remains a critical driver of the Dow’s performance. Factors such as consumer confidence, business investment, and employment data influence market trends. The Dow’s ability to reflect these economic conditions makes it a valuable tool for understanding the broader economic landscape.
History of the Dow
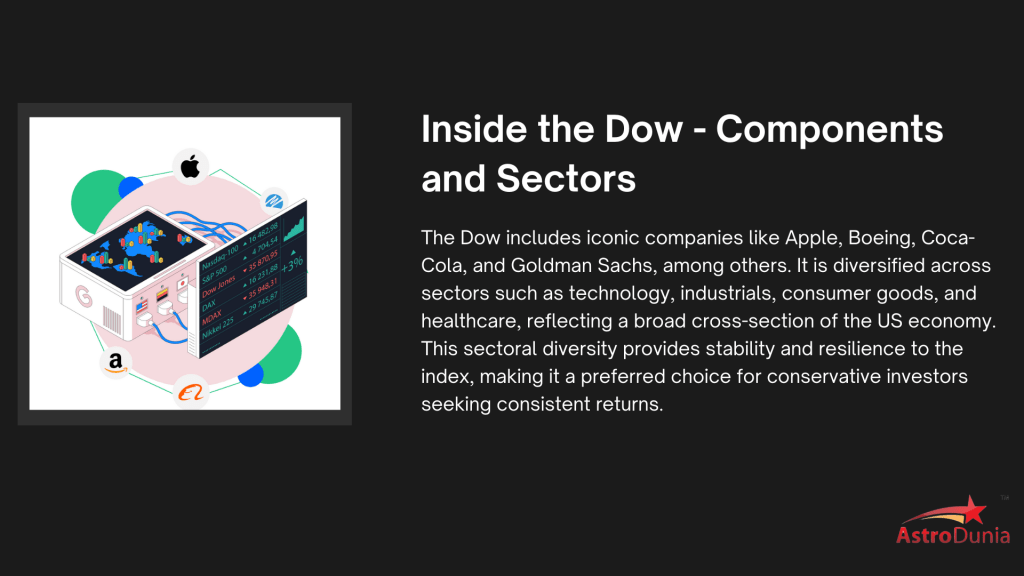
The Dow was created by Charles Dow and Edward Jones in 1896. Initially, it included only 12 companies, primarily in the industrial sector.However, there may be intermediate phases of correction as detailed in the Annual Letter 2024. Over time, it expanded to 30 companies and evolved to reflect a broader spectrum of the U.S. economy, including technology, finance, and consumer goods.
Dow Forecast for 2024
Analysts predict that the Dow will continue its upward trajectory in 2024, driven by economic recovery and corporate earnings growth. Key sectors to watch include technology, healthcare, and industrials. We offer live signals to help you make real-time informed decisions. Join now to stay ahead in the market.
Dow Forecast for Tomorrow
Daily forecasts for the Dow are influenced by market sentiment, economic data releases, and geopolitical events. Traders should monitor key indicators such as employment data, inflation rates, and corporate earnings reports. Get your daily dose of market insights and updates delivered straight to your inbox. Try our Daily Newsletter.
Dow Forecast for the Next 10 Years
Long-term projections for the Dow focus on macroeconomic trends, technological advancements, and demographic shifts. Over the next decade, the Dow is expected to benefit from innovations in technology and healthcare, as well as shifts in global trade dynamics.Want to stay long-term in the market? Join Annual Letter now to make informed decisions.
Dow Forecast for Today
Today’s forecast for the Dow involves analyzing pre-market trends, global market performance, and key economic announcements. Investors should keep an eye on interest rate changes, inflation data, and major corporate news. We offer live signals to help you make real-time informed decisions. Join now to stay ahead in the market.
Dow Forecast for Next Week
Weekly forecasts combine technical analysis and macroeconomic factors. Key events such as Federal Reserve meetings and economic reports will significantly impact market movements. Get your daily dose of market insights and updates delivered straight to your inbox.Try our Daily Newsletter service.
Dow Technical Analysis Today
Technical analysis of the Dow involves examining chart patterns, RSI (Relative Strength Index), MACD (Moving Average Convergence Divergence), and support and resistance levels to identify potential trading opportunities. Join Live signals service for real time market insights and signals.
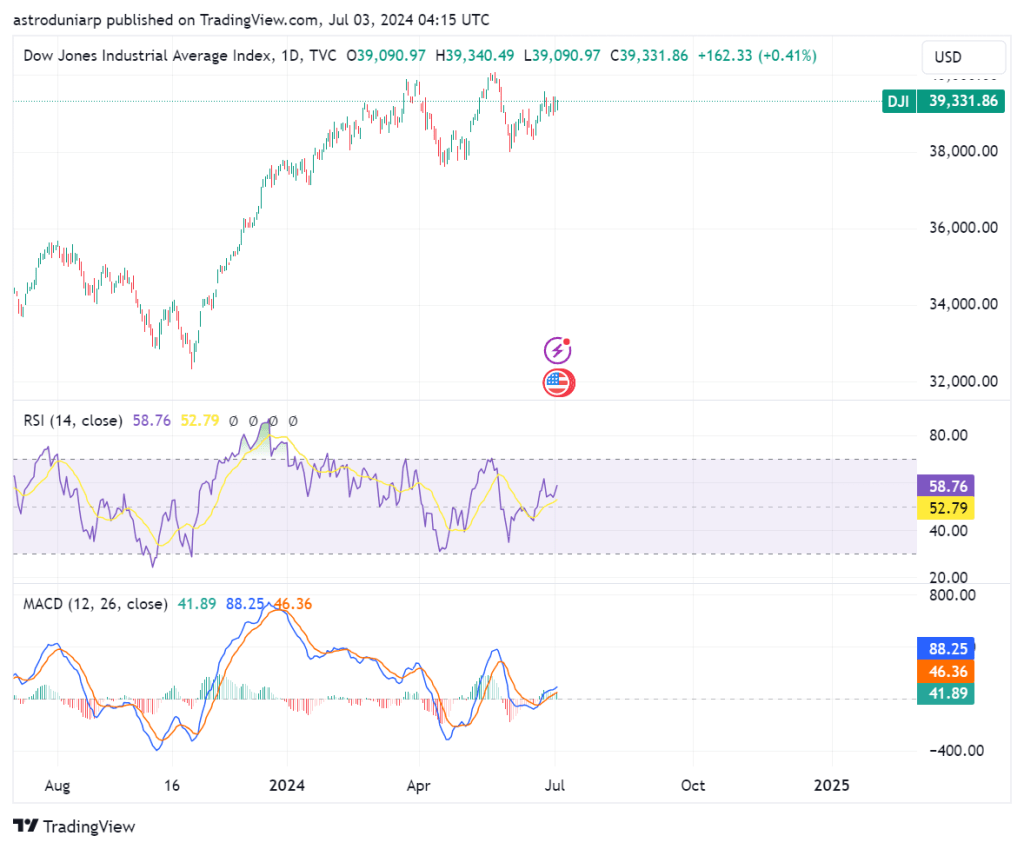
One year performance chart of the Dow index
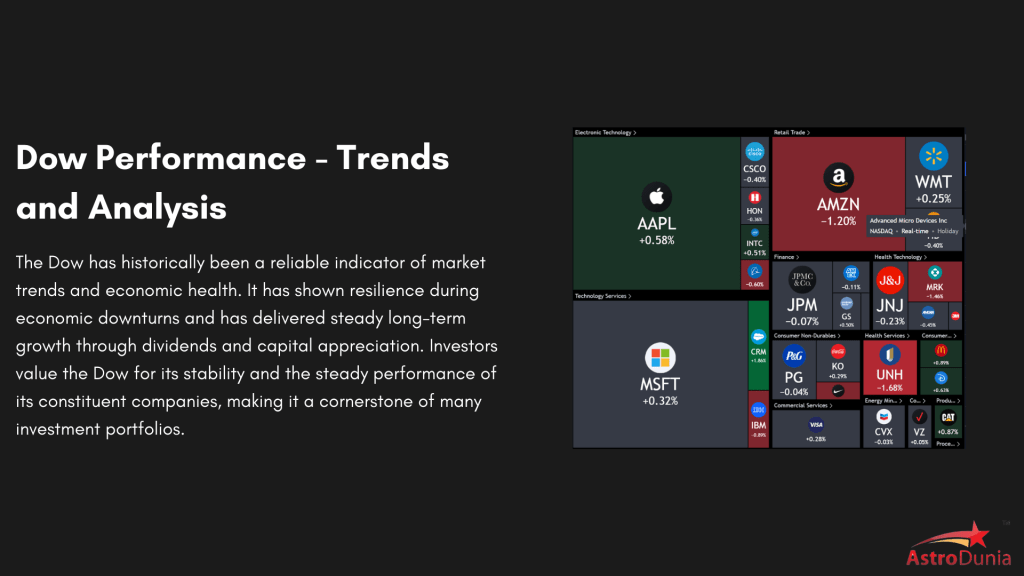
Top 20 Stocks in Dow
Explore the top-performing stocks in the Dow Jones Industrial Average. Click the links below for detailed insights into each stock’s performance, trends, and future outlook.
Future Outlook for the Dow Jones
Looking ahead, the future prospects for the Dow Jones Industrial Average are shaped by several key factors. In the short term, market participants will closely monitor corporate earnings reports, economic data releases, and geopolitical events. These factors can influence investor sentiment and impact the Dow’s performance.
Technological advancements and sector-specific innovations are expected to drive growth in the Dow over the coming years. Sectors such as technology, healthcare, and renewable energy are likely to play a significant role in shaping the index’s future performance. Companies within these sectors are at the forefront of innovation and are poised to benefit from long-term trends, such as digital transformation and the shift towards sustainable energy.
However, the Dow’s future is also subject to potential challenges. Geopolitical tensions, economic policy changes, and market volatility could impact the index’s performance. For instance, trade policies, regulatory changes, and geopolitical conflicts can create uncertainty and affect market dynamics.
In the long term, the Dow is projected to benefit from ongoing economic growth and technological advancements. As the global economy continues to evolve, the index’s diverse range of companies will likely adapt and thrive. Investors should remain informed about market trends and economic indicators to make strategic decisions and navigate potential challenges.
By understanding the Dow’s historical context, current status, and future outlook, investors can gain valuable insights into market trends and make informed decisions. The Dow’s role as a benchmark for U.S. economic performance underscores its importance in financial markets and its relevance for investors seeking to understand and navigate market dynamics.
Dow News Today
Staying updated with the latest news is crucial for informed trading decisions. Major news outlets such as Bloomberg, Reuters, and CNBC provide real-time updates on economic data, corporate earnings, and geopolitical events.
Dow Forecast for the Next 5 Years
Medium-term forecasts consider economic cycles, fiscal policies, and technological trends. The Dow is expected to grow over the next five years, driven by innovation and increased consumer spending, despite potential risks like geopolitical tensions and regulatory changes.
For More Information , you can contact us – +91 9669919000
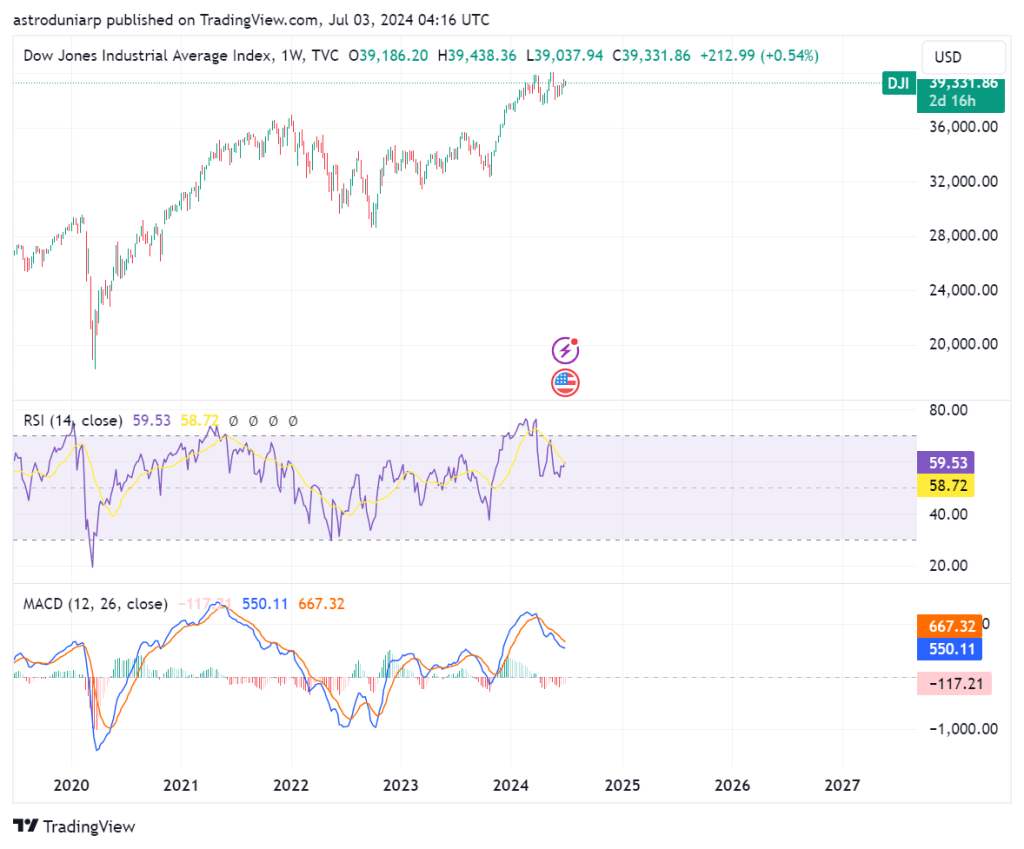
Five-year performance chart of the Dow index
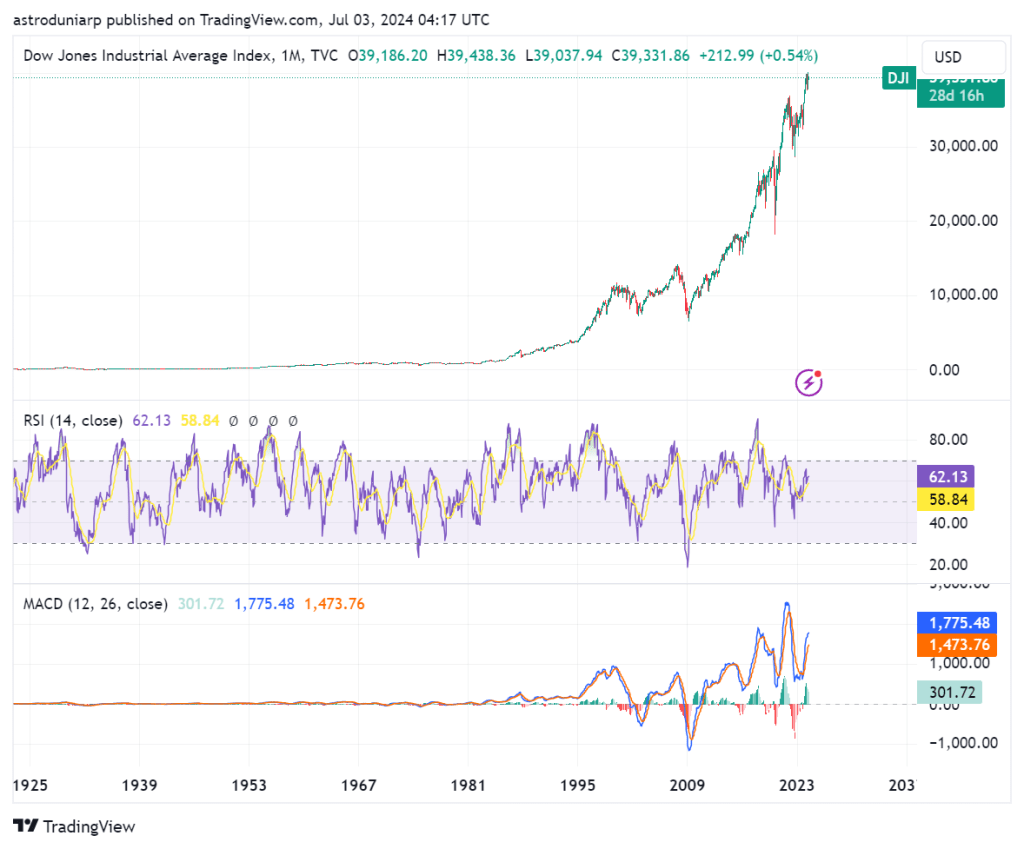
All time performance chart of the Dow index
Dow Jones Industrial Average (DOW)
The Dow Jones Industrial Average (DOW) is a stock market index that measures the stock performance of 30 large companies listed on stock exchanges in the United States.
| No. | ETF Name | Symbol |
| 1. | SPDR Dow Jones Industrial Average ETF | DIA |
| 2. | iShares Dow Jones U.S. ETF | IYY |
| 3. | ProShares Ultra Dow30 | DDM |
| 4. | Invesco Dow Jones Industrial Average Dividend ETF | DJD |
| 5. | Global X Dow 30 Covered Call ETF | DJIA |
| 6. | ProShares Short Dow30 | DOG |
| 7. | ProShares UltraPro Short Dow30 | SDOW |
| 8. | SPDR Dow Jones Global Real Estate ETF | RWO |
| 9. | ProShares UltraPro Dow30 | UDOW |
| 10. | First Trust Dow 30 Equal Weight ETF | EDOW |

Whether you’re a seasoned investor or just starting out, our financial astrology tools can be tailored to your specific investment goals. Gain valuable insights to achieve your financial aspirations.
Address
1301, 13th Floor, Skye Corporate Park, Near Satya Sai Square, AB Road, Indore 452010
+91 9669919000
© All Rights Reserved by RajeevPrakash.com (Managed by AstroQ AI Private Limited ) – 2025