Your cart is currently empty!
Support and Resistance Levels Explained
Support and resistance levels are fundamental concepts in technical analysis, helping traders and investors make informed decisions about buying and selling assets. Support is a price level where a downtrend is expected to pause due to buying interest, while resistance is a price level where an uptrend is expected to pause due to selling pressure. Understanding these levels is crucial for anticipating potential price reversals, identifying entry and exit points, and managing risk effectively. This article will provide a detailed explanation of support and resistance levels, including how to identify them, their significance, and how they can be used in trading strategies.
1. The Basics of Support and Resistance
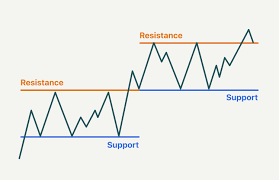
Support and resistance levels are areas on a price chart that indicate where price action has historically had trouble moving beyond. Support acts like a floor that prevents the price from falling further, while resistance acts like a ceiling that prevents the price from rising higher.
According to Zerodha Varsity, support is formed when the price drops to a level where buying interest is strong enough to halt further decline. Conversely, resistance is formed when the price rises to a level where selling interest is strong enough to prevent further increase. These levels are not exact prices but rather zones where price action tends to stall or reverse.
Support and resistance levels are crucial for traders because they provide valuable information about market psychology. When prices approach support, traders may look for buying opportunities, and when prices approach resistance, traders may look for selling opportunities or protect their profits.
2. Identifying Support and Resistance Levels
Support and resistance levels can be identified in several ways, including:
a. Historical Price Data
One of the simplest ways to identify support and resistance levels is by analyzing historical price data. By looking at past price movements, traders can pinpoint areas where the price has consistently reversed or stalled. As highlighted by Fidelity, these historical levels often serve as future support or resistance, providing insights into where the market may react.
b. Trendlines
Trendlines are another popular tool for identifying support and resistance. By drawing lines connecting consecutive highs or lows, traders can visualize areas where the price is likely to find support or resistance. When an uptrend line is broken, it may act as new resistance, while a downtrend line, once broken, may act as support.
c. Moving Averages
Moving averages can also act as dynamic support and resistance levels. For instance, a 50-day or 200-day moving average often provides support during an uptrend and resistance during a downtrend. As mentioned by Investopedia, traders frequently use moving averages to confirm support and resistance levels, especially in trending markets.
d. Psychological Levels
Psychological levels are price levels that traders pay attention to because they are rounded numbers, such as 100, 500, or 1000. These levels tend to attract buying and selling activity, leading to potential reversals. Babypips notes that traders often use these levels as key areas to set their entry or exit points, given the psychological impact they have on market participants.
3. The Importance of Support and Resistance in Trading
Support and resistance levels play a critical role in trading decisions, offering several benefits:
Identifying Entry and Exit Points: Traders use support and resistance to decide when to enter or exit a position. For example, buying near support and selling near resistance can be an effective strategy for capturing gains.
Risk Management: Support and resistance levels provide traders with reference points for placing stop-loss and take-profit orders. This helps manage risk by defining clear levels where trade is invalidated or where profits should be taken.
Market Sentiment: These levels reflect the overall sentiment of the market. When a support level holds, it suggests that buyers are in control, while a break of support indicates that sellers have gained the upper hand. Understanding market sentiment helps traders make informed decisions and adjust their strategies accordingly.
4. Common Strategies Using Support and Resistance
a. Bounce Trading
Bounce trading involves buying near support or selling near resistance in anticipation of a bounce. As described by PriceAction, traders look for confirmation signals, such as candlestick patterns or oscillator indicators, before entering a trade. This approach aims to capitalize on the price bouncing off established support or resistance levels.
b. Breakout Trading
Breakout trading involves taking a position when the price breaks through a significant support or resistance level. A breakout above resistance may signal the beginning of an uptrend, while a breakdown below support may signal a downtrend. IG explains that successful breakout trading often requires confirmation, such as an increase in trading volume, to reduce the risk of false breakouts.
c. Support and Resistance Zones
Instead of treating support and resistance as single price points, traders often consider them as zones. Fidelity highlights the importance of considering these areas as ranges rather than precise levels, especially in volatile markets. This approach helps traders avoid false signals and provides a better understanding of the market dynamics.
5. The Limitations of Support and Resistance
While support and resistance are valuable tools in technical analysis, they are not without limitations:
False Breakouts: Sometimes, the price may briefly break through a support or resistance level only to reverse direction. These false breakouts can lead to losses if traders enter trades prematurely.
Market Volatility: In highly volatile markets, support and resistance levels may not hold as expected, leading to rapid price movements that can trigger stop-loss orders.
Subjectivity: Identifying support and resistance levels can be subjective, as different traders may draw different levels based on their analysis. This subjectivity can lead to varying interpretations and trading decisions.
6. Conclusion: Mastering Support and Resistance Levels
Support and resistance levels are essential tools for any trader looking to navigate the financial markets effectively. By understanding how these levels work, traders can identify potential entry and exit points, manage risk, and better understand market sentiment. Whether using historical data, trendlines, or moving averages, the key to successful trading lies in mastering these levels and incorporating them into a comprehensive trading strategy.
However, it’s important to remember that support and resistance are not foolproof. Traders must remain vigilant for false breakouts and adjust their strategies based on market conditions. By combining support and resistance analysis with other technical indicators, traders can enhance their trading decisions and increase their chances of success.

Mr. Rajeev Prakash
Rajeev is a well-known astrologer based in central India who has a deep understanding of both personal and mundane astrology. His team has been closely monitoring the movements of various global financial markets, including equities, precious metals, currency pairs, yields, and treasury bonds.
Featured Post
Financial Astrology Terminal
The Financial Astrology Terminal is a web platform that combines real-time U.S. market data (S&P 500, Nasdaq, Dow, Russell, key stocks and commodities like gold and silver) with planetary cycles, giving traders and investors astro-timing signals on top of normal charts and analysis.