Your cart is currently empty!
Stock Market Support and Resistance Calculator
Understanding support and resistance levels is crucial for any trader or investor looking to make informed decisions in the stock market. These levels represent key areas on a price chart that indicate where a stock is likely to experience buying or selling pressure. A Support and Resistance Calculator can help traders pinpoint these levels and use them to improve their trading strategies. This comprehensive guide will explore how to use a stock market support and resistance calculator effectively, why these levels are important, and how they can be leveraged to maximize profitability.
Support and Resistance Calculator
ResistanceSupport
1. Understanding Support and Resistance in the Stock Market
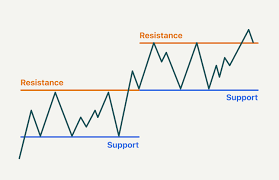
Support refers to a price level where a stock tends to find buying interest, preventing the price from declining further. Essentially, it acts as a floor that supports the stock price. When the price approaches the support level, buyers tend to step in, causing the stock to bounce back.
Resistance, on the other hand, is the price level at which selling pressure tends to overcome buying pressure, preventing the price from rising further. It acts as a ceiling, where traders expect increased selling activity.
These support and resistance levels are important because they help traders identify key price points where price reversals or breakouts are likely. By using a support and resistance calculator, traders can determine these levels systematically and integrate them into their trading strategies.
2. The Importance of Support and Resistance Levels
Support and resistance levels play a critical role in the stock market for several reasons:
Decision-Making: These levels help traders make decisions regarding entry and exit points in the market. For instance, a trader might choose to buy a stock when it is near a support level and sell when it approaches a resistance level.
Setting Stop-Loss: Support and resistance levels can help determine optimal stop-loss levels to manage risk effectively. Setting stop-loss orders just below support or above resistance can help minimize losses.
Identifying Trends: Support and resistance levels also help in identifying trends. When a stock breaks a support level, it may indicate a downtrend, while breaking a resistance level may suggest an uptrend.
3. How Does a Stock Market Support and Resistance Calculator Work?
A stock market support and resistance calculator is a tool designed to identify potential support and resistance levels automatically by analyzing historical price data. These calculators use different methods to identify levels, such as moving averages, Fibonacci retracements, and pivot points.
Pivot Points: These are calculated using the high, low, and close prices of a previous trading period, helping traders identify possible turning points in the market.
Moving Averages: Moving averages can act as dynamic support and resistance levels that change as the stock’s price evolves.
Fibonacci Retracements: This method is based on the Fibonacci sequence and helps identify potential areas of price retracement.
The support and resistance calculator at RajeevPrakash.com allows traders to input historical price data and get an accurate calculation of key levels. This makes it easier for both beginners and experienced traders to plan their trades effectively.
4. Setting Up a Support and Resistance Calculator in Excel
Creating a support and resistance calculator in Excel can be very useful for traders who prefer a more hands-on approach to analyzing price charts. Here are the steps to set up a basic support and resistance calculator in Excel:
Step 1: Define Key Inputs
To set up a support and resistance calculator, you need to gather the following inputs:
- High Price: The highest price of the stock during a given period.
- Low Price: The lowest price of the stock during the same period.
- Close Price: The closing price of the stock for that period.
Step 2: Calculate Pivot Points
Pivot points are commonly used to determine support and resistance levels. The formula for calculating the pivot point (P) is:
Step 3: Calculate Support and Resistance Levels
- Resistance Level 1 (R1):
= (2 * P) - Low - Resistance Level 2 (R2):
= P + (High - Low) - Support Level 1 (S1):
= (2 * P) - High - Support Level 2 (S2):
= P - (High - Low)
These formulas can be input into Excel to calculate potential support and resistance levels for any given stock based on historical price data.
5. Using the Support and Resistance Calculator for Trading
Support and resistance calculators can be used for a variety of trading strategies:
Range Trading: In range-bound markets, traders can use support and resistance levels to enter trades near support and exit near resistance.
Breakout Trading: When the price breaks through a support or resistance level, it may indicate a strong price movement. Traders can use these levels to enter breakout trades and ride the trend.
Stop-Loss Placement: Placing stop-loss orders below support levels (for long trades) or above resistance levels (for short trades) helps manage risk.
6. Practical Example of Using Support and Resistance Calculator
Consider a scenario where a trader wants to identify key support and resistance levels for a stock listed on the NSE:
- High Price: INR 500
- Low Price: INR 450
- Close Price: INR 480
Using the pivot point formula:
- Pivot Point (P):
(500 + 450 + 480) / 3 = INR 476.67
Next, calculate the support and resistance levels:
- Resistance Level 1 (R1):
(2 * 476.67) - 450 = INR 503.34 - Resistance Level 2 (R2):
476.67 + (500 - 450) = INR 526.67 - Support Level 1 (S1):
(2 * 476.67) - 500 = INR 453.34 - Support Level 2 (S2):
476.67 - (500 - 450) = INR 426.67
These levels provide key insights into where the stock is likely to face buying or selling pressure, helping the trader make more informed decisions.
7. Benefits of Using a Support and Resistance Calculator
There are numerous benefits to using a support and resistance calculator in the stock market:
Objectivity: Calculators provide objective data points, reducing the emotional bias often associated with trading.
Efficiency: Calculators save time by providing quick calculations of key levels, allowing traders to focus on strategy rather than manual calculations.
Better Risk Management: By identifying key levels, traders can place better stop-loss orders, thereby managing risk more effectively.
8. Using Support and Resistance Levels Across Different Asset Classes
Support and resistance levels are not only applicable to stocks; they can also be used in other asset classes:
Forex: In currency trading, support and resistance levels can help traders determine entry and exit points, especially in volatile currency pairs.
Commodities: For commodities such as gold or crude oil, identifying support and resistance levels can help traders manage their risk and take advantage of price swings.
Cryptocurrencies: The high volatility in cryptocurrencies makes support and resistance levels crucial for identifying potential turning points in the market.
9. Common Mistakes When Using Support and Resistance Levels
While support and resistance calculators can be powerful tools, there are common mistakes traders should avoid:
Ignoring Market Context: Support and resistance levels should not be used in isolation. Consider the broader market context, such as trends and news events, before making trading decisions.
Using Static Levels: Markets are dynamic, and support and resistance levels can change over time. It is important to continually update and re-evaluate these levels.
Relying Solely on Historical Data: While historical data is important, it is also crucial to consider real-time factors that could influence price movements.
10. The Support and Resistance Calculator at RajeevPrakash.com
For traders who prefer a more automated approach, RajeevPrakash.com offers an easy-to-use support and resistance calculator that simplifies the entire process. By inputting basic price data, traders can quickly receive accurate support and resistance levels that can be used for making well-informed trading decisions.
This tool is especially useful for those who want to save time and ensure that their trading strategies are based on objective data points rather than relying solely on intuition.
11. Backtesting with Support and Resistance Levels
Backtesting is an essential component of any successful trading strategy. By using historical price data to calculate support and resistance levels, traders can backtest their strategies to determine their effectiveness in different market conditions. Excel provides an excellent platform for backtesting support and resistance levels over historical data to validate a strategy before using it in live markets.
12. Conclusion: Leveraging Support and Resistance for Market Success
Understanding and utilizing support and resistance levels is vital for any trader looking to succeed in the stock market. By using a support and resistance calculator, traders can effectively determine where the price is likely to face buying or selling pressure, allowing them to make better-informed trading decisions.
Tools like the Support and Resistance Calculator at RajeevPrakash.com simplify the process of determining these critical levels, ensuring that traders have a clear and objective view of the market. Whether you are a beginner or an experienced trader, integrating support and resistance analysis into your trading strategy is key to improving your profitability and managing risk effectively.

Download The Financial Calculator App
Discover all the incredible features of our app designed to enhance your experience. From intuitive tools to unique services tailored for your needs, the app offers endless possibilities. Don’t miss out—click the link below to learn more and see how it can make a difference in your life today.

Mr. Rajeev Prakash
Rajeev is a well-known astrologer based in central India who has a deep understanding of both personal and mundane astrology. His team has been closely monitoring the movements of various global financial markets, including equities, precious metals, currency pairs, yields, and treasury bonds.