Your cart is currently empty!
Stock Resistance and Support Calculator
In the world of stock trading, understanding key price levels is crucial for making informed decisions. Support and resistance are two fundamental concepts that traders use to identify levels where the price of a stock is likely to reverse or consolidate. A stock resistance and support calculator can help traders determine these levels more efficiently, allowing them to set better entry and exit points. In this comprehensive guide, we’ll explore what support and resistance are, how a calculator can be used to determine these levels, and the benefits of integrating this tool into your trading strategy.
1. What Are Support and Resistance Levels?
Support and resistance levels are price points that act as barriers to the movement of a stock’s price. Understanding these levels helps traders predict potential price movements and make better trading decisions.
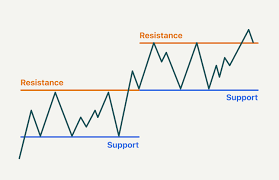
Support: A support level is a price point where the stock tends to find buying interest, preventing it from falling further. It’s like a floor where the price tends to stop declining and possibly bounce back up.
Resistance: A resistance level is a price point where selling pressure tends to prevent the price from moving higher. It acts like a ceiling where the price tends to stop rising and may reverse downward.
2. The Importance of Support and Resistance in Trading
Support and resistance levels play a vital role in trading, as they help traders identify potential areas for buying or selling:
Entry and Exit Points: Traders use support and resistance to determine ideal entry and exit points. Buying near support and selling near resistance can increase the chances of a successful trade.
Risk Management: By identifying these levels, traders can place stop-loss orders just below support or above resistance, which helps manage risk.
Market Sentiment: These levels also act as indicators of market sentiment. A break above resistance suggests bullish momentum, while a drop below support indicates bearish sentiment.
3. How Does a Stock Resistance and Support Calculator Work?
A stock resistance and support calculator is a tool that helps traders identify key support and resistance levels based on historical price data, moving averages, Fibonacci retracements, and other technical indicators. Here’s how it works:
Input Data: The calculator requires input data, such as recent high, low, and closing prices of the stock.
Calculate Key Levels: Using mathematical formulas and technical analysis, the calculator determines potential support and resistance levels. These levels may be based on pivot points, Fibonacci retracement levels, or historical price movements.
Provide Levels: The calculator provides support and resistance levels that traders can use to plan their trades, set stop-loss orders, and identify potential breakout or reversal points.
4. Types of Support and Resistance Calculators
There are several types of calculators that traders can use to identify support and resistance levels:
Pivot Point Calculator: A pivot point calculator uses the previous day’s high, low, and close to calculate potential support and resistance levels for the current trading day. Pivot points are widely used by day traders to identify intraday price levels.
Fibonacci Retracement Calculator: A Fibonacci retracement calculator identifies potential support and resistance levels based on the Fibonacci sequence. Traders often use these levels to predict price retracements during a trending market.
Moving Average Calculator: A moving average calculator uses moving averages to identify dynamic support and resistance levels. Moving averages, such as the 50-day or 200-day moving average, often act as support or resistance.
5. Practical Example of Using a Stock Resistance and Support Calculator
Consider a stock with the following recent price data:
- High: 150
- Low: 130
- Close: 145
Using a pivot point calculator, the following calculations can be made to determine potential support and resistance levels:
- Pivot Point (P) = (High + Low + Close) / 3 = (150 + 130 + 145) / 3 = 141.67
Based on the pivot point, the first level of Resistance (R1) and Support (S1) can be calculated as follows:
- Resistance 1 (R1) = (2 × Pivot Point) – Low = (2 × 141.67) – 130 = 153.34
- Support 1 (S1) = (2 × Pivot Point) – High = (2 × 141.67) – 150 = 133.34
These levels provide traders with potential areas where the stock may face buying or selling pressure, allowing them to plan their trades accordingly.
6. Benefits of Using a Stock Resistance and Support Calculator
Objectivity: A resistance and support calculator provides objective price levels, removing emotional bias from trading decisions.
Efficiency: Calculating support and resistance levels manually can be time-consuming. A calculator streamlines the process, allowing traders to focus on strategy.
Risk Management: By identifying key price levels, traders can set more effective stop-loss and take-profit orders, improving their risk management.
7. How to Incorporate Support and Resistance Levels into Your Trading Strategy
Support and resistance levels are best used as part of a broader trading strategy. Here are some ways to incorporate these levels effectively:
Identify Entry and Exit Points: Buy near support and sell near resistance to take advantage of price reversals. Use the calculator to determine precise levels.
Use Confirmation Indicators: Combine support and resistance levels with other technical indicators, such as RSI or MACD, to confirm potential trades.
Set Stop-Loss and Take-Profit Orders: Place stop-loss orders just below support when buying and just above resistance when selling to manage risk.
Identify Breakout Opportunities: When the price breaks above a resistance level or falls below a support level, it may indicate a significant trend change. Use the calculator to identify these breakout opportunities.
8. Common Mistakes When Using Support and Resistance Levels
While support and resistance levels are powerful tools, traders should avoid the following common mistakes:
Ignoring Market Context: Support and resistance levels should not be used in isolation. Always consider the overall market trend and sentiment before making trading decisions.
Setting Levels Too Rigidly: Support and resistance levels are not exact prices but rather zones where price action is likely to occur. Avoid treating them as precise numbers.
Not Adjusting Levels: Market conditions change, and support and resistance levels may evolve. Adjust these levels as new data becomes available to ensure accuracy.
9. Tools for Identifying Support and Resistance Levels
For traders looking for an easy way to identify support and resistance levels, RajeevPrakash.com offers a Stock Resistance and Support Calculator that can help traders determine key price levels. By entering recent high, low, and closing prices, traders can receive calculated support and resistance levels, helping them make more informed trading decisions.
This tool is particularly helpful for beginners who are learning how to identify key price levels and for experienced traders who want to streamline their analysis process.
10. Conclusion: Mastering Price Levels with a Stock Resistance and Support Calculator
A stock resistance and support calculator is an invaluable tool for traders looking to enhance their market analysis and make better trading decisions. By providing objective and efficient calculations of key price levels, this tool helps traders identify entry and exit points, manage risk, and capitalize on price movements.
Whether you are new to trading or have years of experience, understanding and using support and resistance levels effectively is crucial to your success. By incorporating a stock resistance and support calculator into your trading routine, you can take a more structured approach to analyzing price action and improve your overall trading strategy.

Download The Financial Calculator App
Discover all the incredible features of our app designed to enhance your experience. From intuitive tools to unique services tailored for your needs, the app offers endless possibilities. Don’t miss out—click the link below to learn more and see how it can make a difference in your life today.

Mr. Rajeev Prakash
Rajeev is a well-known astrologer based in central India who has a deep understanding of both personal and mundane astrology. His team has been closely monitoring the movements of various global financial markets, including equities, precious metals, currency pairs, yields, and treasury bonds.