Sector Rotation Analyzer
Every market cycle has a hidden rhythm. Even when the index looks flat or choppy, money is constantly rotating beneath the surface from one sector to another. Capital quietly exits tired themes and migrates toward fresh leadership, often weeks or months before headlines catch up. A trader or investor who can read this rotation gains a powerful edge, because they stop thinking only about whether the market is going up or down and start asking a deeper question: which sectors are leading, which are lagging and where is capital likely to move next. The idea behind a Sector Rotation Analyzer is to give that edge a clear, repeatable and visual form.
Instead of guessing based on random charts or social media noise, the Sector Rotation Analyzer organises market behaviour into a structured view. It shows how sectors move through different phases of leadership, how their relative strength evolves over time, which groups are emerging as new leaders and which ones are quietly rolling over. With that framework in place, you can align your portfolio with the sectors that have genuine sponsorship, rather than staying stuck in yesterday’s stories. The result is a more dynamic, responsive and risk aware approach to equities.
When you bring this mindset into your trading or investing routine, sector rotation stops being a vague idea and becomes a concrete process. You are no longer asking only whether the index will rise or fall next week. You are also asking where the strongest trends are, where early accumulation is happening and which sectors are entering late stage exhaustion. The Sector Rotation Analyzer gives you a visual language for those questions and helps you answer them through objective relative performance data instead of emotion or opinion.
Why Sector Rotation Is Central To Modern Equity Trading
In modern equity markets, broad indices such as the S&P 500, Nasdaq or STOXX Europe 600 are increasingly dominated by a handful of mega cap names. These giants can mask what is really happening beneath the surface. The index might hold steady even while there is violent rotation between growth and value, cyclicals and defensives, or domestic and global themes. If you only watch the index, you can completely miss these internal battles. Sector rotation analysis forces you to look inside the index, where leadership actually lives.
Institutional investors, from large mutual funds to hedge funds and pension managers, constantly adjust their exposure between sectors as economic conditions evolve. When they become more optimistic about growth or liquidity, they may rotate toward technology, consumer discretionary or financials. When they fear slowdown or tightening conditions, they often seek safety in healthcare, utilities or staples. This flow of money is what drives relative performance patterns. By watching sector rotation, you effectively track where large pools of capital are going, rather than guessing from price alone.
Sector rotation is also deeply connected to the business cycle. Early in a recovery, cyclical and interest rate sensitive sectors may begin to outperform as markets anticipate improving growth. In the middle of an expansion, technology, industrials and consumer sectors might dominate. Late in the cycle, defensive groups can start to take the lead as investors prepare for volatility or slower growth. A Sector Rotation Analyzer helps you map your current environment against this backdrop and see which part of the cycle the market is behaving like, even if macro data is noisy or confusing.
Sector Rotation Across Different Geographies And Styles
Sector rotation is not limited to a single market. The same logic applies across geographies and investment styles. A Sector Rotation Analyzer can easily be extended to global regions, comparing the relative strength of sectors within the United States, Europe, Asia or emerging markets. In some cycles, US technology and communication services may dominate global leadership; in others, energy or basic materials tied to global growth and commodity cycles may lead from different regions.
From Static Sector Lists To Dynamic Rotation Maps
Most investors are familiar with static sector lists such as technology, healthcare, energy, financials and so on. These lists help categorize companies, but they do not tell you how leadership is changing over time. A Sector Rotation Analyzer takes those familiar sectors and transforms them into a dynamic map. Instead of a flat list, you see sectors arranged according to where they sit in the current rotation, whether they are leading, improving, weakening or lagging against the overall market.
This dynamic map recognises that leadership is never permanent. A sector can move from laggard to leader, from leader to tired favourite and from tired favourite back to a neutral position as the cycle evolves. The Analyzer captures that motion by focusing on relative strength, not just absolute returns. It asks a simple question: compared to the benchmark, is this sector gaining power, losing power, or essentially moving sideways. That question is then translated into visuals you can interpret at a glance.
By turning static lists into dynamic rotation maps, you stop thinking of sectors as fixed boxes and start seeing them as moving players on a field. Some are pressing forward, others are retreating and a few are stuck in the middle. This perspective instantly changes the way you approach portfolio design. Instead of spreading money evenly across all sectors or being stuck in what you like, you begin to tilt into real leadership and away from fading momentum.
If you are a short term trader
Follow intraday and swing signals on SPX, Nasdaq, Dow, Russell, Gold and more, with timing windows that help you avoid noise and focus on high-probability moves.
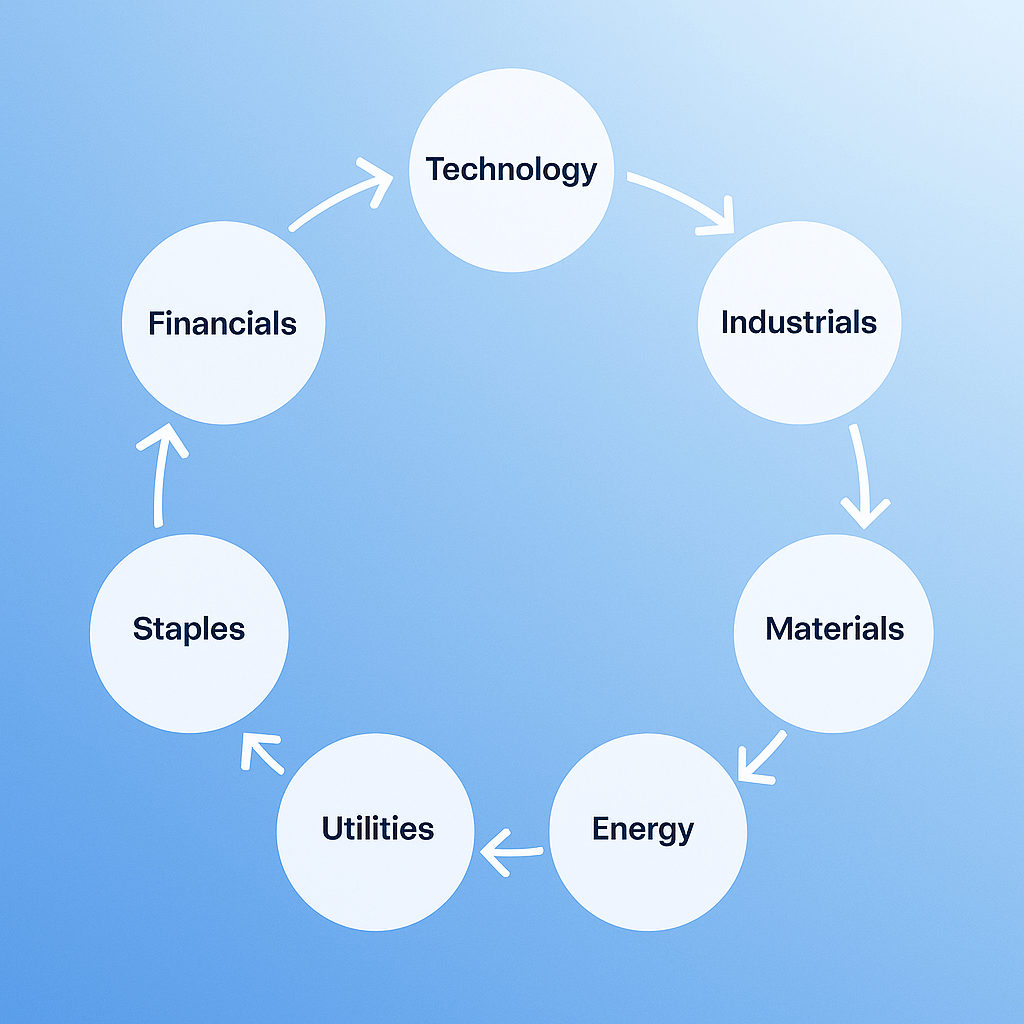
Understanding The Sector Rotation Wheel
At the heart of the Sector Rotation Analyzer is the rotation wheel. Imagine a circular map divided into zones, where sectors travel clockwise as their relative performance evolves. One quadrant represents emerging leaders, another shows strong outperformers, a third captures weakening leadership and the final quadrant tracks laggards that may eventually become value opportunities. Each sector is represented as a point or marker that moves gradually around the wheel as its relative strength and momentum change.
A sector might enter the improving zone when its relative strength starts to turn up from depressed levels. As its outperformance becomes consistent, it migrates into the leading zone, where it enjoys strong sponsorship and attracts fresh capital. After an extended run, signs of fatigue and slower momentum can push it into the weakening zone, even if its absolute price is still high. If the trend continues, it slides into the lagging zone, where relative strength is clearly negative. Over time, new sectors replace it as the fresh leaders, and the wheel continues to turn.
This visual rotation wheel simplifies complex performance relationships. Instead of trying to read a dozen separate charts, you can glance at the wheel and quickly identify clusters. If several cyclical sectors are grouped together in the leading or improving quadrants while defensives sit in lagging zones, the market is likely in a risk on phase. If defensive groups move into leadership while cyclicals and high beta sectors fade, the market may be leaning toward caution. The wheel converts a messy web of data into a simple visual that mirrors the actual behaviour of capital flows.
The Relative Strength Timeline As The Memory Of Leadership
While the rotation wheel gives a snapshot of the current moment, the relative strength timeline provides memory. For each sector, the Sector Rotation Analyzer keeps track of how its performance versus the benchmark has evolved over time. This might be visualised as a line chart showing the ratio of sector total return to index total return over different lookback windows. The shape of this timeline tells a story about the durability and quality of leadership.
If the relative strength timeline slopes steadily upward for months with moderate volatility, the sector is enjoying a healthy, sustainable leadership phase. This is the kind of trend many investors seek, because it reflects consistent accumulation rather than erratic speculation. If the line is choppy, full of spikes and collapses, leadership may be fragile or noisy. Such patterns can still be traded, but they require a more tactical mindset. A persistent downward slope, on the other hand, indicates a prolonged lagging phase, where the sector continuously underperforms and attracts little sponsorship.
By combining the rotation wheel with the relative strength timeline, you get both position and path. You see where the sector is today on the wheel and how it moved there. A sector that recently emerged from a long lagging period into the improving quadrant with a fresh upward turn in its relative strength timeline may offer a compelling early opportunity. A sector that has sat in the leading quadrant for a very long time while its timeline begins to flatten could be entering a vulnerable stage, even if headlines still celebrate it as a champion.
If you are a long term investor
Use the Annual Letter 2026 to navigate macro cycles, sector rotation and multi-month themes across global assets, without reacting to every intraday swing.
Reading A Leading And Lagging Sector Heatmap
Another powerful visual within the Sector Rotation Analyzer is the leading and lagging heatmap. Here, sectors are arranged in rows and lookback periods in columns, with each cell coloured according to the degree of outperformance or underperformance. Deep positive shades indicate strong leadership, while negative shades highlight weakness. Neutral tones reflect performance that largely tracks the benchmark. This grid allows you to see not only individual sectors but also the broader pattern of rotation across time horizons.
If you notice that certain sectors are brightly coloured in short term columns but more neutral in longer term columns, they may represent recent emergers whose leadership is still young and possibly fragile. Sectors with persistent positive shading across multiple timeframes show entrenched leadership that has held up through various market phases. Conversely, areas of deep negative shading across timeframes reveal structural laggards that have failed to attract sustained buying interest.
The heatmap also makes it easy to detect theme clusters. You might see that energy, materials and industrials all show improving colours after a period of weakness, hinting at a global cyclical turn. Or you might notice that utilities, healthcare and staples are the only sectors with consistent positive shading while most others bleed negative colours, signalling a defensive rotation. In each case, the heatmap gives you the big picture in one glance, saving you from piecing together insights from scattered charts.
Using Sector ETF Backtesting To Test Rotation Ideas
Visual tools are powerful, but they become even more convincing when you link them to historical evidence. That is where a sector ETF backtesting layer inside the Sector Rotation Analyzer becomes valuable. Sector ETFs provide real, investable proxies for broad groups such as technology, financials, healthcare, energy and so on. By backtesting simple allocation rules based on rotation signals, you can see how different sector rotation strategies would have behaved over past cycles.
For example, you might instruct the Analyzer to simulate a strategy that allocates a portion of capital to the top few sectors based on relative strength each month, rebalancing systematically. You can then compare its performance to a static, equal weight or market cap weighted benchmark. The results will show how much benefit rotation added in terms of return, volatility and drawdown. Another test might focus on defensive rules, such as reducing exposure to sectors that drop into persistent lagging status while increasing allocation to stable leaders.
These backtests do not offer a perfect prediction of the future, but they give you a grounded sense of how sector rotation has historically rewarded or punished certain behaviours. You might discover, for instance, that blindly chasing recent leaders without regard for how long they have already led tends to produce poor results. Or you might see that combining rotation signals with simple risk filters, such as market trend confirmation, significantly improves outcomes. The key is that backtesting connects the visual story of rotation with hard numbers, reinforcing or challenging your assumptions.
How Sector Rotation Guides Entry And Exit Timing
Sector rotation is not only about what to own, but also when to adjust positions. The rotation wheel and relative strength timelines provide natural reference points for entry and exit timing. When a sector moves from lagging into improving and its timeline breaks a persistent downtrend, that often marks an early stage of potential leadership. Traders and investors can use this signal as a prompt to research high quality names within that sector and build positions gradually as the improvement confirms. This avoids the common mistake of chasing sectors only after they have already enjoyed a long period of outperformance.
On the exit side, when a sector has spent a long time in the leading quadrant and the relative strength timeline begins to lose momentum, the Analyzer warns that leadership may be maturing. The sector might still deliver gains for a while, but its risk reward profile is no longer as attractive. By slowly scaling out or tightening risk management in such sectors, you reduce the chances of being caught by the first significant correction. You can also watch for the moment when a leading sector formally crosses into the weakening quadrant and its timeline breaks key relative support levels
Building A Weekly Sector Rotation Routine
To turn the Sector Rotation Analyzer into a practical edge, it needs to be embedded into a regular routine, not just used occasionally. A simple but powerful approach is to run a weekly rotation review. In this review, you scan the rotation wheel to see which sectors are in the leading and improving zones, which ones are sliding into weakening or lagging positions and how the overall balance between offensives and defensives is shifting. You then cross check these impressions with the relative strength timelines and the leading or lagging heatmap.
This weekly ritual helps you step back from day to day noise and focus on the evolving structure of the market. You ask whether leadership is broadening or narrowing, whether new themes are emerging quietly before the crowd notices and whether older themes are losing momentum even as commentators continue to praise them. With this information, you adjust your watchlist, your sector allocations and your individual stock ideas. You also refine your expectations about which types of setups are likely to work best in the current environment.
For swing traders, this routine might guide which sectors they prefer for breakout attempts and where they stay selective or sidelined. For longer term investors, it could shape how they tilt their portfolio toward growth, value, defensive or cyclical groups over the next quarter. In both cases, the goal is not to trade every blip in rotation, but to remain in sync with the broad direction of sector flows, recognising that this direction often leads macro headlines rather than follows them.
Using Sector Rotation To Build And Maintain The Watchlist
A well structured watchlist is critical for any trader or investor, and sector rotation can make this process far more strategic. Instead of compiling a random collection of interesting names, you can organise your watchlist around the sectors that the Analyzer highlights as improving or poised to lead. For each of these sectors, you identify a set of high quality stocks that represent different sub themes or market capitalisations. You then monitor those names for technical setups, valuation opportunities or fundamental catalysts, knowing that they operate within a favourable sector environment.

Common Mistakes In Interpreting Sector Rotation
Like any analytical framework, sector rotation can be misused if applied without care. One common mistake is overreacting to very short term moves on the rotation wheel. Sectors can experience brief surges or pullbacks due to specific news or events without indicating a genuine change in leadership. If you treat every small shift as a major signal, you risk churning your portfolio and incurring unnecessary costs. The solution is to always interpret sector rotation over multiple timeframes. Short term changes should be cross checked against medium and longer term relative strength trends before you make big decisions.
Another frequent error is ignoring the broader market context. A sector may move into the leading quadrant during a period when the overall market is deeply oversold or experiencing an unusual shock. That leadership might be temporary and driven by a scramble for safety or liquidity, rather than a sustainable trend. If you chase that apparent leadership without considering whether the move aligns with the prevailing macro environment, you may find yourself overexposed to a sector that quickly loses its edge when conditions normalise. Sector rotation signals are most powerful when they align with or presage macro shifts, not when they contradict them without explanation.
A third pitfall is focusing on sectors in isolation, without considering diversification. It is tempting to place very large bets on a single sector because it appears strongly in the leading quadrant. While such bets can yield big rewards when correct, they also introduce concentration risk that can be painful if the rotation reverses. A more resilient approach is to tilt toward clusters of sectors that share similar characteristics and leadership patterns, while keeping overall risk within your predefined limits. The Analyzer helps you identify those clusters by showing how multiple sectors move together across quadrants and timeframes.
Integrating Sector Rotation With Risk Budgeting And Position Sizing
Sector rotation becomes even more powerful when you link it explicitly with risk budgeting and position sizing. Instead of treating rotation signals as qualitative hints, you can convert them into rules about how much of your total risk budget to assign to different sectors. When the Analyzer shows broad and healthy leadership across several sectors with supportive relative strength timelines, you might be comfortable allocating a larger portion of your risk budget to equities and to the leading and improving groups in particular. Your position sizes within those sectors can be moderately larger than usual, because the environment offers a tailwind.
When leadership fractures, and the rotation wheel becomes more fragmented with few clear leaders and many sectors drifting between weakening and lagging quadrants, you can shrink your overall risk budget. In such a regime, you might reduce the number of open positions, size them more conservatively and place more emphasis on capital preservation. The Analyzer becomes your early warning system that the cost of risk is rising and that a more defensive posture is appropriate. By linking rotation readings to risk budgets, you remove much of the emotional noise that often drives position sizing decisions.
Within each sector, position sizing can also reflect rotation strength. For example, you might adopt a framework in which stocks within sectors that are firmly in the leading or improving quadrants qualify for slightly larger allocations, while those in neutral or weakening sectors are kept smaller or avoided. This does not mean ignoring individual company analysis, but it recognises that a strong sector backdrop improves the odds that good companies will be rewarded, while a weak sector backdrop can dampen even strong stock level fundamentals.
Aligning Sector Rotation With Different Trading Styles
Different trading styles can all benefit from sector rotation analysis, but they will apply it in distinct ways. Short term traders often treat sector rotation as a context filter. If the Analyzer shows technology and communication services in strong leadership, a short term trader may prioritise setups in those sectors, confident that they have powerful sponsorship. If the Analyzer shows defensives leading and cyclicals lagging, that same trader might shift toward mean reversion or short side tactics in weaker groups rather than forcing aggressive longs in out of favour sectors.
Swing traders, who hold positions for days to weeks, may lean heavily on the rotation wheel and relative strength timelines. They look for sectors moving from improving into leading positions, because these transitions often produce multi week trending moves. They might also look for sectors that have rolled over from leading into weakening, treating rallies in those areas with more caution. For them, sector rotation becomes a core component of their edge, shaping both which themes they ride and when they take profits or rotate out.
Longer term investors, such as those running diversified equity portfolios, will use the Sector Rotation Analyzer to manage their higher level tilts. They may maintain a strategic baseline allocation across sectors, but allow tactical overweights or underweights based on rotation signals. When a sector enjoys long lived leadership with supportive fundamentals, they may overweight that area. When another sector deteriorates into sustained lagging status and the rotation tools show no sign of meaningful improvement, they may underweight it. Over full cycles, this measured tilt strategy can meaningfully improve outcomes without forcing constant trading.
Why Choose Us ?
Astrodunia guides you through the market’s ups and downs with the help of planetary science. Our team of experts in financial astrology provide valuable insights and predictions to assist you in market wise investment decisions and navigate the global market with ease.
Market Forecasting
Experience the advantage of enhanced market predictions. Our unique approach combines traditional analysis with astrological insights for more accurate predictions and better investment opportunities.

Decades of Market Timing Expertise
For over 20 years, we’ve honed our skills in market timing within the stock market. Our extensive experience allows us to navigate market trends with precision and confidence.

Trusted by Discerning Investors
Our clients choose us for our proven track record of success and our commitment to providing them with the most reliable market insights. Join the ranks of satisfied investors who trust our expertise
Risk Management Through The Lens Of Sector Rotation
Sector rotation is not only about finding opportunities; it is also a powerful tool for managing risk. Many sharp drawdowns in individual portfolios come from being overexposed to sectors that have quietly begun to lag while the index still looks healthy. The Sector Rotation Analyzer makes these early cracks visible. When a sector leaves the leading quadrant after a long run and begins to drift into weakening status, its relative strength timeline often starts to flatten or roll over. If your portfolio is heavily concentrated in that sector, this is a clear signal to reconsider your exposure.
In the same way, the heatmap can highlight when rotation has become dangerously narrow. If only one or two sectors carry the bulk of leadership while most others languish in neutral or negative colours, the overall market may be more fragile than the index suggests. Recognising this, you might reduce leverage, broaden your diversification or tighten risk controls. Conversely, when leadership is broad and multiple sectors show healthy improvement, the market environment can be more forgiving, allowing you to hold trends with greater confidence.
Risk management also improves when you consciously separate stock level issues from sector level context. If a stock disappoints in a sector that is generally weak and lagging, you might be less surprised and more willing to exit. If a similar disappointment happens in a sector that the rotation tools show as strong and healthy, you may treat it as a stock specific problem rather than a sign of sector wide trouble. This ability to distinguish between stock noise and sector signal is crucial for consistent decision making.
Testimonials
Discover what our satisfied customers have to say about their experience with us. Read our testimonials from people just like who have benefited from our services.
Market singals have helped me to make quick and informed decisions for trades in stock market. resulting in significant profits for my portfolio. The team is highly professsional and always available to answer your questions and provide the best customer service.
SK Jhunjhunwala
Investor based in Mumbai
I have been using the astrodunia’s services for over 4+ years now and have been extremely impressed with level of experties and precions they bring to the table. Their live market signals have helped me make quick and informed decisions.
N. Patel
Pennsylvania , US
Excellent service. This is undoubtedly the best market forecast newsletter that i have ever subscribed. None of the other newsletter are anywhere close to this terms of accuracy. Please continue with the good work !
Withheld
Fixed income trader with a required foreign bank in asia
i am an entrepreneur based in Australia and have been subscriber of astrodunia services from the past two years.i have found their NewsLetter , Live Signals and Annual Letter to be incredibly valueable.
Z. Irani
Australia
Combining Sector Rotation With Macro And Micro Views
A Sector Rotation Analyzer sits at the intersection of macro and micro analysis. On the macro side, sector performance often reflects themes such as interest rate expectations, growth prospects, inflation trends and liquidity conditions. On the micro side, sector strength arises from earnings upgrades, innovation, regulatory changes and competitive dynamics. By observing rotation, you are effectively watching how macro forces and micro stories blend into actual capital flows.
You can use this blend consciously. If macro data and liquidity indicators suggest a shift toward reflation, you naturally expect cyclicals and value oriented sectors to respond. The Sector Rotation Analyzer helps you confirm whether that shift is truly underway or whether it remains a narrative without sponsorship. If macro conditions darken but defensives and high quality sectors do not yet show strong leadership in the rotation tools, the market may still be in a denial phase. This tension between expectation and observed rotation provides valuable information.
At the same time, bottom up research on specific companies becomes more powerful when it is placed within the right sector context. A strong stock idea in a sector that the Analyzer shows as improving or leading has a tailwind behind it. The same idea in a relentlessly lagging sector faces an uphill battle, no matter how attractive the story looks on paper. Recognising this, you can align your micro convictions with sectors that already have macro sponsorship, stacking edges instead of working against them.
Meet Our Team
Get to know our dedicated team of experts. With a diverse range of skills and years of experience, we’re committed to providing you with the best market analysis and investment guidance.

Mr. Rajeev Prakash Agarwal
Founder
Expert in financial & personal astrology for 20 years+. Rajeev is a well-known astrologer based in central India who has a deep understanding of both personal and mundane astrology.

Mr. Shashi Prakash Agarwal
Technical Head
Shashi is a technology leader with a strong background in global business.He holds a B. Tech in Computer Science & MBA in Finance from Narsee Monjee Institute of Management Studies, one of the top B-Schools in India.
Making Sector Rotation A Habit, Not A One-Time Exercise
The real value of a Sector Rotation Analyzer emerges when you treat it as a habit. The market is always rotating, always shifting emphasis and always testing new leadership. A single snapshot can be interesting, but it does not tell you how robust a move is. By revisiting the rotation wheel, relative strength timelines, heatmaps and backtested behaviour at a consistent frequency, you begin to develop an intuitive feel for how sectors behave through different phases of the cycle.
Over time, you will remember periods when leadership was broad and durable, and you will recall how the Analyzer looked during those times. You will also remember periods when leadership was narrow, fading or erratic, and how the visuals captured that fragility. This lived memory inside your own process makes you more sensitive to early warning signs and more confident when genuine turnarounds begin. The Sector Rotation Analyzer evolves from a new tool into a natural extension of how you think about markets.
In the end, sector rotation is not a secret trick; it is simply an honest way of acknowledging that markets are made of many moving parts. Some sectors lead, others follow and all of them take turns as the cycle unfolds. The Sector Rotation Analyzer gives you a clear, structured and visual way to track those turns, align with genuine leadership and manage risk when leadership fractures. By integrating it into your weekly routine and combining it with your macro and stock level research, you create a disciplined edge that keeps you close to where capital is truly flowing, rather than where narratives say it should be.
Whether you’re a seasoned investor or just starting out, our financial astrology tools can be tailored to your specific investment goals. Gain valuable insights to achieve your financial aspirations.
Address
1301, 13th Floor, Skye Corporate Park, Near Satya Sai Square, AB Road, Indore 452010
+91 9669919000
© All Rights Reserved by RajeevPrakash.com (Managed by AstroQ AI Private Limited) – 2025