The RSI Moving Average Crossover Strategy is a popular and effective method used by traders to identify and capitalize on trend reversals in the market. By combining the Relative Strength Index (RSI) with moving averages, traders can create a powerful tool that provides clear signals for entering and exiting trades. This strategy is particularly useful for those looking to enhance their technical analysis and improve the timing of their trades. In this guide, we’ll explore the key components of the RSI Moving Average Crossover Strategy, how to implement it, and tips for maximizing its effectiveness.
Understanding the RSI and Moving Averages
Before diving into the RSI Moving Average Crossover Strategy, it’s essential to understand the two main indicators involved:
- Relative Strength Index (RSI): The RSI is a momentum oscillator that measures the speed and change of price movements. It ranges from 0 to 100 and is typically used to identify overbought or oversold conditions in the market. An RSI above 70 indicates overbought conditions, while an RSI below 30 suggests oversold conditions.
- Moving Averages (MA): A moving average smooths out price data to create a single flowing line that represents the average price over a specific period. Commonly used moving averages include the simple moving average (SMA) and the exponential moving average (EMA). Moving averages help identify the direction of the trend and potential reversal points.
How the RSI Moving Average Crossover Strategy Works
The RSI Moving Average Crossover Strategy combines the RSI with one or more moving averages to generate trade signals. Here’s how it works:
- Identify the Trend: First, use moving averages to determine the overall trend direction. For example, if the price is above the 50-day moving average, the trend is considered bullish; if it’s below, the trend is bearish.
- Monitor RSI Levels: Next, monitor the RSI to gauge the strength of the trend. The RSI should confirm the direction of the trend indicated by the moving averages. For instance, in a bullish trend, the RSI should ideally be above 50, indicating momentum in the upward direction.
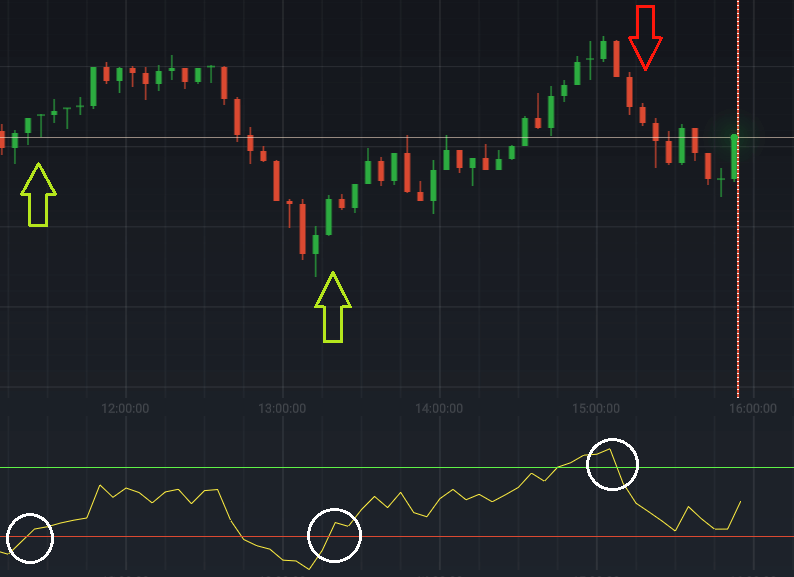
- Crossover Signal: The key signal in the RSI Moving Average Crossover Strategy occurs when the RSI crosses above or below a moving average of the RSI itself (e.g., a 14-day RSI crossing above its 9-day moving average). A bullish signal is generated when the RSI crosses above its moving average, indicating that the price may continue to rise. Conversely, a bearish signal is generated when the RSI crosses below its moving average, suggesting a potential decline in price.
- Confirm the Signal: It’s crucial to confirm the crossover signal with the trend direction indicated by the moving averages. Only take trades that align with the overall trend to improve the strategy’s accuracy.
- Enter and Exit Trades: Once a valid crossover signal is confirmed, enter the trade in the direction of the trend. Set stop-loss levels below recent support (for long trades) or above recent resistance (for short trades) to manage risk. Exit the trade when the RSI crosses back in the opposite direction or when the price approaches a significant support or resistance level.
Example of the RSI Moving Average Crossover Strategy
Let’s look at a practical example of how the RSI Moving Average Crossover Strategy can be applied:
- Step 1: A stock is in an uptrend, with the price consistently above the 50-day SMA.
- Step 2: The RSI is above 50, confirming the bullish momentum.
- Step 3: The 14-day RSI crosses above its 9-day moving average, generating a bullish signal.
- Step 4: Enter a long trade, placing a stop-loss just below the recent swing low.
- Step 5: Exit the trade when the RSI crosses below its moving average or the price reaches a key resistance level.
Interactive Tool
Strategy Parameter Optimiser Calculator
Choose your goal, volatility, timeframe, and style. This tool suggests RSI and Moving Average settings for an RSI + MA crossover strategy. Use it to test conservative vs aggressive configurations quickly.
Inputs
Optional filters
Tip: Start with Balanced, then switch only one input at a time. That makes differences clearer.
Recommended Settings
RSI settings
—
—
MA crossover settings
—
—
Signal rules (simple)
What to expect
Important note
These are heuristic recommendations, not a backtest. Markets differ by liquidity and regime. Use these settings as a starting point, then validate on your preferred asset and timeframe with disciplined risk controls.
Disclaimer: Educational only. Not investment advice.
Advantages of the RSI Moving Average Crossover Strategy
The RSI Moving Average Crossover Strategy offers several advantages for traders:
- Improved Timing: By combining RSI with moving averages, traders can improve the timing of their entries and exits, leading to more precise trades.
- Trend Confirmation: The strategy helps confirm the trend direction, reducing the likelihood of false signals and increasing the probability of successful trades.
- Versatility: This strategy can be applied across different markets, including stocks, forex, and commodities, making it a versatile tool for traders.
- Risk Management: The use of stop-loss orders and trend confirmation helps manage risk, protecting against significant losses.
Potential Drawbacks and Considerations
While the RSI Moving Average Crossover Strategy is powerful, it’s not without its limitations:
- Lagging Signals: Moving averages are lagging indicators, meaning they reflect past price action. This can result in delayed signals, especially in fast-moving markets.
- False Signals: In choppy or sideways markets, the RSI may generate false signals, leading to potential losses. It’s important to use additional filters or confirm signals with other indicators.
- Overfitting: Customizing the RSI and moving average periods too much can lead to overfitting, where the strategy works well on historical data but fails in live markets.
Tips for Maximizing the RSI Moving Average Crossover Strategy
To get the most out of the RSI Moving Average Crossover Strategy, consider the following tips:
- Adjust Periods: Experiment with different periods for the RSI and moving averages to find the best fit for your trading style and the specific asset you’re trading.
- Combine with Other Indicators: Use additional indicators, such as volume or MACD, to confirm signals and reduce the likelihood of false trades.
- Backtest the Strategy: Before using the strategy in live markets, backtest it on historical data to ensure it performs well under different market conditions.
- Stay Disciplined: Stick to your trading plan and avoid deviating from the strategy based on emotions or market noise.
Conclusion
The RSI Moving Average Crossover Strategy is a powerful tool for trend traders looking to enhance their technical analysis. By combining the momentum insights of the RSI with the trend-following capabilities of moving averages, traders can generate precise entry and exit signals. While no strategy is foolproof, understanding and applying the RSI Moving Average Crossover Strategy effectively can significantly improve your trading performance, especially in trending markets. With careful implementation and risk management, this strategy can become a valuable addition to your trading arsenal.

Download The Financial Calculator App
Discover all the incredible features of our app designed to enhance your experience. From intuitive tools to unique services tailored for your needs, the app offers endless possibilities. Don’t miss out—click the link below to learn more and see how it can make a difference in your life today.
