Understanding the RSI Down Price Up phenomenon is a critical divergence signal in technical analysis, often indicating a potential reversal or weakening of a trend. This occurs when the Relative Strength Index (RSI) trends downward while the price of an asset continues to rise. Recognizing this divergence is essential for traders and investors who rely on technical indicators to make informed decisions. In this article, we’ll delve into the mechanics of the RSI Down Price Up signal, explore its implications, and discuss strategies for incorporating it into your trading approach.
What is RSI and How Does it Work?
The Relative Strength Index (RSI) is a momentum oscillator that measures the speed and change of price movements on a scale of 0 to 100. Typically, an RSI above 70 indicates that an asset is overbought, while an RSI below 30 suggests that it is oversold. Traders use RSI to identify potential entry and exit points based on the likelihood of price reversals.
However, RSI can also reveal divergences, where the momentum of an asset does not align with its price movement. One such divergence is the RSI Down Price Up scenario, which signals that while the price continues to climb, the underlying momentum is weakening.
The Significance of RSI Down Price Up Divergence
For Understanding RSI Down Price Up divergence occurs when the price of an asset makes higher highs, but the RSI forms lower highs. This divergence can indicate that the bullish momentum driving the price upwards is losing strength, even though the price is still increasing. As a result, this divergence can be a warning sign that the current uptrend might be nearing its end, and a reversal or pullback could be imminent.
Interactive Tool
Divergence Detection & Strength Calculator
Enter two swing points for Price and RSI. Point A is older, Point B is newer. This tool identifies divergence type and estimates strength, confidence, and a simple action plan.
Inputs
Swing points
Point A = earlier swing. Point B = later swing. Use the same two points for Price and RSI. Example: two highs for bearish divergence, or two lows for bullish divergence.
Point A (older)
Point B (newer)
Context (helps scoring)
Optional confirmations
Tip: If you are analysing “RSI down, Price up”, use two highs (A and B) to check for bearish divergence.
Results
Divergence type
—
Enter values to detect divergence.
Strength score
—
—
Action bias
Why this score
Quick interpretation guide
Divergence is stronger when price and RSI clearly disagree (one rises while the other falls), the RSI change is meaningful, and the swing points are reasonably spaced. Confirmation (structure break, volume, trend filter) improves practical reliability.
Disclaimer: Educational only. Not investment advice.
How to Identify RSI Down Price Up Divergence
To spot an RSI Down Price Up divergence, follow these steps:
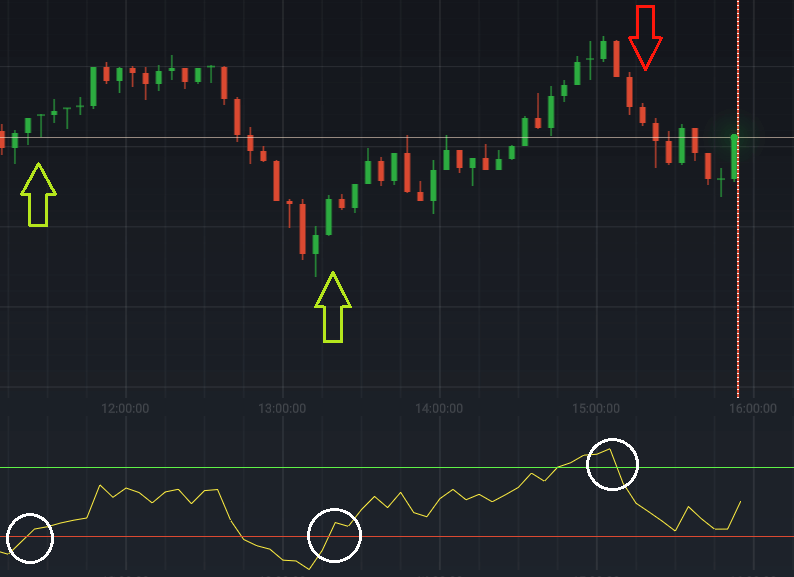
- Monitor the Price Trend: Begin by identifying the overall trend of the asset's price. In this case, you're looking for a series of higher highs, indicating that the price is trending upward.
- Check the RSI: Look at the RSI line to see if it is making lower highs while the price is making higher highs. This discrepancy is the key indicator of the RSI Down Price Up divergence.
- Confirm the Divergence: For stronger confirmation, compare the divergence with other technical indicators, such as volume or moving averages, to ensure that the signal is reliable.
Trading Strategies Using RSI Down Price Up
When you identify an RSI Down Price divergence, it’s essential to have a strategy in place to capitalize on the potential trend reversal. Here are a few approaches:
- Prepare for a Reversal: Since the divergence suggests weakening bullish momentum, consider preparing for a potential reversal. You might begin reducing your long positions or setting tighter stop-loss levels to protect profits.
- Look for Confirmation: Before acting on the divergence, wait for additional confirmation, such as a bearish candlestick pattern or a break below a key support level. This can help avoid false signals and ensure you’re entering a trade at the right moment.
- Enter Short Positions: If the divergence is confirmed and other indicators align, consider entering a short position to profit from the anticipated decline. Set stop-loss orders to manage risk, particularly if the trend resumes its upward trajectory.
- Use RSI as a Reentry Point: If the price does reverse, you can use RSI to identify oversold conditions for potential reentry points, allowing you to buy back into the asset at a lower price.
Example of RSI Down Price Up in Action
Imagine a stock that has been on a steady upward climb, making higher highs over several weeks. However, as you monitor the RSI, you notice that while the price continues to rise, the RSI is making lower highs. By Understanding RSI Down Price Up divergence suggests that the upward momentum may be fading.
In response, you decide to closely watch the stock for any signs of a reversal. When the price finally breaks below a key support level, you enter a short position, anticipating a decline. As expected, the stock price begins to fall, confirming the divergence signal and allowing you to profit from the reversal.
Limitations and Considerations
While the RSI Down Price Up divergence can be a powerful tool in predicting trend reversals, it’s not infallible. Here are a few limitations to keep in mind:
- False Signals: Divergences don’t always result in immediate reversals. In some cases, the price may continue to rise despite the weakening RSI, leading to false signals. It’s crucial to confirm divergence with additional indicators or price action analysis.
- Timeframes Matter: The reliability of the RSI Down Price Up signal can vary depending on the timeframe. Shorter timeframes may produce more frequent but less reliable signals, while longer timeframes may offer more significant but less frequent opportunities.
- Market Conditions: Divergences tend to be more reliable in trending markets. In choppy or sideways markets, the RSI Down Price Up signal may be less effective, as the price movement could be more erratic.
Conclusion
The RSI Down Price Up divergence is a valuable signal in technical analysis, helping traders identify potential trend reversals even when prices continue to rise. By understanding how to spot and interpret this divergence, you can enhance your trading strategy and make more informed decisions in the market. However, as with any technical indicator, it’s essential to use the RSI Down Price Up signal in conjunction with other tools and techniques to maximize its effectiveness and reduce the risk of false signals.
