Every trader eventually reaches the same important question: should you trust what the chart is directly showing, or should you rely on technical indicators to guide your decisions? This debate sits at the center of modern trading. Some traders prefer the clean simplicity of price action patterns, where candles, support and resistance, breakouts, and reversals tell the story. Others feel more comfortable with indicators like RSI, MACD, moving averages, Bollinger Bands, and stochastic oscillators because they offer structure and measurable signals.
The truth is that both approaches have value, but they work in different ways and suit different trading personalities. Price action patterns focus on the raw movement of the market. Indicators, on the other hand, are built from price and sometimes volume, which means they are derived tools rather than direct market behavior. That difference matters because it affects timing, clarity, and the ability to respond quickly to changing conditions.
For beginners, indicators may appear easier because they simplify decision-making. For experienced traders, price action often feels more natural because it reflects the market in its purest form. Yet neither method is automatically superior in every situation. The better method depends on your trading style, your risk management discipline, your market selection, and how well you understand the strengths and weaknesses of each approach.
This is why the discussion around price action patterns vs indicators remains so relevant in forex, stocks, crypto, commodities, and indices. Traders are not just choosing tools. They are choosing how they want to read the market, how fast they want to react, and how much complexity they want in their strategy.
In this detailed guide, we will examine what price action patterns are, what indicators do, how each method works in real trading, and which one tends to perform better under different market conditions. By the end, you will have a clearer understanding of whether price action patterns or indicators are the better fit for your trading journey.
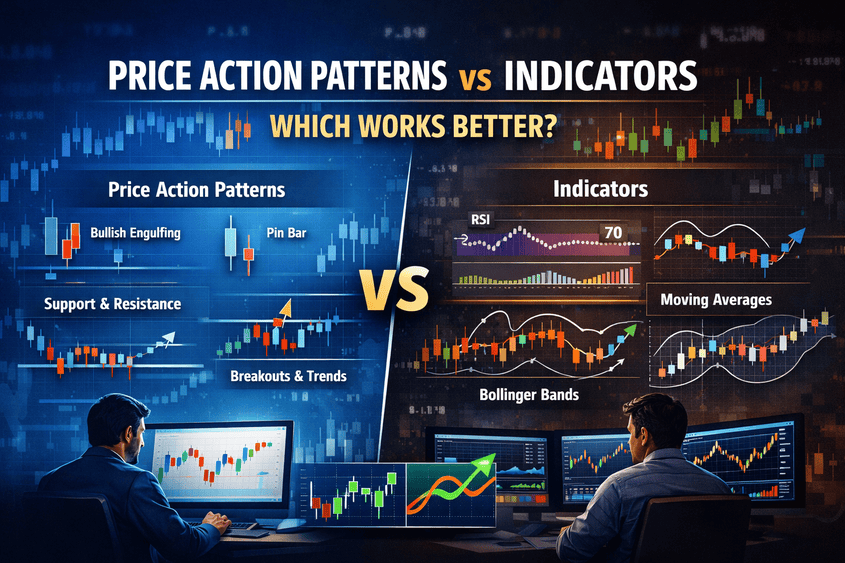
What Are Price Action Patterns?
Price action patterns are formations created by the movement of price itself on a chart. They do not depend on external calculations. Instead, they come directly from how buyers and sellers interact. When a market forms a bullish engulfing candle, a double top, a breakout from consolidation, or a pin bar at a major support level, that is price action speaking directly through the chart.
The appeal of price action trading lies in its simplicity. Traders observe the chart, identify zones where price has reacted in the past, and then wait for recognizable patterns to form around those areas. These patterns often reveal market sentiment, momentum shifts, failed breakouts, trend continuation, or exhaustion.
Price action patterns include candlestick formations like doji, hammer, shooting star, engulfing candles, and inside bars. They also include broader chart patterns such as head and shoulders, triangles, flags, wedges, double tops, double bottoms, and rectangular consolidations. In many cases, a trader is not just looking for a shape. They are looking for context. A bullish candle means very little in the middle of random noise, but the same bullish candle at a strong demand zone after a pullback in an uptrend can become highly meaningful.
Price action trading teaches traders to focus on market structure. Higher highs and higher lows suggest bullish strength. Lower highs and lower lows suggest bearish control. Sideways movement suggests indecision. Once traders learn to read these shifts, they begin to understand the market more like a flowing auction rather than a set of isolated signals.
This direct relationship with the chart is the reason many professional traders respect price action so much. It strips away clutter and keeps the focus on what matters most: price.
Price Action vs Indicators: Find Your Trading Style
Answer a few quick questions to discover whether price action trading, indicator-based trading, or a hybrid approach suits you better.
What Are Technical Indicators?
Technical indicators are tools that use mathematical calculations based on price, volume, or both. They help traders interpret the market by turning raw chart data into visual signals. These tools are designed to identify trend direction, momentum, volatility, overbought conditions, oversold conditions, and possible reversals.
Some of the most popular indicators include moving averages, RSI, MACD, Bollinger Bands, ADX, stochastic oscillator, and ATR. A moving average smooths price to show the direction of the trend. RSI attempts to measure momentum and whether the market may be overbought or oversold. MACD tracks changes in momentum and trend strength. Bollinger Bands help traders assess volatility and possible breakout or mean reversion zones.
The main advantage of indicators is that they make analysis more structured. Instead of asking whether a trend “looks strong,” a trader can observe whether price is above the 50-day moving average or whether RSI is rising above a certain threshold. This appeals to traders who prefer rules over interpretation.
However, indicators are not magic tools. They are built from past price data, which means they usually lag behind the market to some extent. A moving average crossover, for example, often confirms a trend only after it has already begun. That does not make indicators useless. It simply means traders need to understand what indicators can and cannot do.
Indicators are best understood as helpers rather than decision-makers. They can confirm a setup, highlight conditions, and reduce emotional guesswork. But when traders rely on them blindly without understanding the price behind them, problems begin.
The Core Difference Between Price Action and Indicators
The biggest difference between price action patterns and indicators is that price action is direct, while indicators are derived. Price action shows what is happening now on the chart. Indicators process what has already happened and present it in a different form.
This difference has practical consequences. Price action traders often react earlier because they are watching the market structure develop in real time. Indicator traders often wait for confirmation because their tools are designed to reduce false signals, even if that means entering later.
A breakout trader using price action might enter when price closes above resistance with strong momentum. A trader using indicators may wait until the moving averages align, RSI confirms momentum, and MACD shows bullish crossover. The price action trader may get a better entry, but also faces a higher risk of false breakouts. The indicator trader may avoid some fake moves, but might miss the best part of the trend.
This is why the question is not just which one works better in theory. It is which one helps you make better decisions consistently.
Why Many Traders Prefer Price Action Patterns
Price action patterns have earned a strong following because they keep trading simple, visual, and adaptable. A trader who understands support and resistance, trend structure, and candle behavior can analyze almost any liquid market without adding multiple tools.
One major advantage of price action is clarity. When the chart is clean, the trader can focus on key levels and reactions rather than becoming overwhelmed by conflicting signals. This reduces confusion and helps develop a more intuitive feel for the market.
Another advantage is faster decision-making. Since price action is the direct source of information, traders do not need to wait for calculations to catch up. They can spot rejection, momentum shifts, or breakout behavior as it unfolds.
Price action is also highly flexible across time frames. A day trader can use it on a five-minute chart, while a swing trader can use it on daily and weekly charts. The same principles of trend, consolidation, breakout, and reversal remain relevant.
Perhaps most importantly, price action encourages deeper market understanding. Traders begin to think in terms of buyer and seller behavior. Instead of asking whether RSI is above 70, they ask whether buyers are losing momentum near resistance. That shift in thinking can improve long-term trading skill because it builds true chart-reading ability rather than dependence on preset signals.
Why Many Traders Prefer Indicators
Indicators remain popular because they offer structure, discipline, and a sense of objectivity. For many traders, especially beginners, this is extremely valuable. A clean rule such as buying when price crosses above the 200-day moving average feels easier to follow than interpreting candles and support zones.
Indicators also help reduce emotional trading. A trader who uses clear entry and exit rules based on indicators is less likely to enter random trades. This can be especially useful for people who struggle with impulsive decisions.
Another strength of indicators is their ability to standardize strategies. Traders can backtest a moving average system, optimize indicator settings, and create repeatable frameworks. This appeals to systematic traders who want data-supported decision-making.
Indicators can also provide useful confirmation. For example, a breakout above resistance becomes more convincing when accompanied by rising volume, expanding volatility, and strengthening momentum. In these situations, indicators help traders filter out low-quality setups.
For traders who are still learning market behavior, indicators can act as training wheels. They provide signals that make the chart easier to interpret. Over time, many traders begin with indicators and later transition toward a more price action-focused style.
The Problem With Price Action Patterns
Although price action trading is powerful, it is not perfect. One of its biggest challenges is subjectivity. Two traders can look at the same chart and interpret it differently. One may see a valid breakout. Another may see a fake move into resistance. This can make price action difficult for beginners.
Another issue is that price action requires patience and screen time. Learning to read candles and structure well takes experience. There is no shortcut to understanding when a pattern is meaningful and when it is just market noise.
Price action also struggles in choppy conditions. When the market is range-bound and directionless, patterns can fail frequently. A breakout can reverse quickly. A reversal signal can lose momentum. Without the right context, price action setups become unreliable.
Some traders also overcomplicate price action by seeing patterns everywhere. Once that happens, the chart becomes as confusing as an over-indicator setup. The key is not to memorize dozens of formations, but to understand a few core behaviors deeply.
The Problem With Indicators
Indicators have their own weaknesses, and the biggest one is lag. Since most indicators are calculated from past price data, they often respond after the move has already started. This can lead to late entries and less favorable risk-reward opportunities.
Another common problem is signal overload. When traders place too many indicators on a chart, they often receive mixed messages. One indicator may suggest bullish momentum while another suggests overbought conditions. This creates hesitation and inconsistency.
Indicators can also create false confidence. Because they appear mathematical, traders may assume they are more reliable than they really are. In reality, an indicator is only as useful as the context in which it is applied. An RSI reading above 70 does not automatically mean a market will fall. Strong trends can stay overbought for long periods.
There is also the danger of dependency. Some traders become so reliant on indicators that they stop learning how price actually behaves. When market conditions change, they struggle because they do not understand the underlying story.
Which Works Better in Trending Markets?
In strong trending markets, both price action patterns and indicators can work well, but they perform differently. Price action often gives earlier entries. Pullbacks to support in an uptrend, bullish continuation candles, and breakout retests can provide excellent opportunities before indicators fully confirm the move.
Indicators, however, can help traders stay in the trend longer. Moving averages are especially useful in trending conditions because they smooth out noise and help traders avoid exiting too early. Trend-following traders often use indicators to hold positions with greater confidence.
If the goal is early participation, price action usually has the edge. If the goal is staying disciplined throughout the trend, indicators can be very helpful. In many cases, the best results come from combining the two.
Which Works Better in Range-Bound Markets?
In sideways or range-bound markets, both methods can face challenges, but indicators like RSI and stochastic often become more useful because they are designed to identify overbought and oversold conditions. These tools can help traders spot reversals inside a range.
Price action can still work well if the range boundaries are clear. Rejection candles at support and resistance can provide strong entries. However, false breakouts are common in ranges, so pure price action traders need to be careful.
In these conditions, indicators sometimes offer better guidance because they highlight momentum exhaustion more clearly. Still, the trader must first identify that the market is actually ranging. Without that context, indicator signals can be misleading.
Which Is Better for Beginners?
For beginners, indicators often feel easier at first because they provide visual structure. A new trader may find it easier to follow a moving average crossover or an RSI rule than to interpret subtle candlestick behavior.
However, long-term improvement often comes from learning price action. Traders who understand support and resistance, trend structure, and candle behavior develop stronger chart-reading skills over time. This makes them less dependent on tools and more adaptable in different conditions.
A smart approach for beginners is to start with a small number of indicators while learning price action alongside them. That way, the trader builds discipline without becoming locked into mechanical signals alone.
Can Price Action and Indicators Be Used Together?
Yes, and in many cases this is the best solution. The debate between price action patterns vs indicators often creates a false choice. Traders do not always need to pick one and reject the other. The strongest strategies often use price action for setup identification and indicators for confirmation or trade management.
For example, a trader may identify a bullish breakout from consolidation using price action. Then they may use volume or moving averages to confirm that the breakout has real strength. Another trader may spot a reversal candlestick pattern at support and then check RSI divergence for added confidence.
This blended method works because each approach compensates for the weakness of the other. Price action improves timing and market understanding. Indicators improve structure and discipline.
The key is balance. If you rely too much on indicators, the chart becomes cluttered. If you rely only on raw price without rules, you may become inconsistent. A clean chart with one or two well-chosen indicators is often more effective than an extreme on either side.
Which Works Better?
The most honest answer is that price action patterns generally work better for traders who want deeper market understanding, earlier entries, and cleaner analysis. Indicators generally work better for traders who want more structure, clearer rules, and easier confirmation.
If you ask which method builds stronger trading skill over time, price action has the edge. It teaches you how markets move, how trends form, how reversals develop, and where buyers and sellers are active. Those lessons remain useful regardless of the market or platform.
If you ask which method is easier to follow at the beginning, indicators may seem more approachable. They simplify the decision-making process and reduce the burden of interpretation.
In practical trading, the strongest answer is not that one completely defeats the other. It is that price action should be the foundation, while indicators should play a supporting role. When traders understand price first and then use indicators for confirmation, they often make better decisions than traders who rely only on one side.
Conclusion
The comparison between price action patterns vs indicators is not just about tools. It is about how you choose to understand the market. Price action gives you the market in its rawest and most direct form. Indicators reshape that information into signals that are easier to standardize and test.
Price action patterns offer speed, clarity, adaptability, and a deeper connection to market behavior. Indicators offer structure, confirmation, and discipline. Both can work. Both can fail. What matters most is whether the method fits your personality, your strategy, and your level of experience.
For most traders, price action provides the stronger long-term edge because it teaches the language of the market itself. Indicators become most effective when they support that understanding rather than replace it. A trader who can read price well and use indicators wisely is usually in a stronger position than a trader who depends entirely on either method alone.
If your goal is to become a more confident and capable trader, start by learning how price moves. Understand trend, structure, support, resistance, and market reactions. Then add only the indicators that genuinely improve your decision-making. That approach keeps your trading focused, practical, and grounded in what the market is actually doing.
