Price action trading remains one of the most trusted approaches in the financial markets because it focuses on the most direct source of truth available to any trader, which is price itself. While indicators, algorithms, and news feeds all have their place, price action patterns continue to help traders understand momentum, reversals, breakouts, and market psychology with clarity. In 2026, this approach is still highly relevant because markets are moving faster, liquidity conditions can change quickly, and traders need a framework that works across stocks, forex, commodities, and indices.
Price action patterns are not magical formulas. They are visual representations of buying and selling behavior. Every candle, every swing high, every pullback, and every breakout reflects the ongoing battle between bulls and bears. When traders learn to read these formations correctly, they gain a better understanding of where momentum is building, where weakness is emerging, and where the next opportunity may appear.
For WordPress readers and trading audiences, this topic has strong value because it appeals to both beginners and experienced market participants. New traders often search for clear explanations of chart patterns, while advanced traders look for refined interpretations that can improve timing and discipline. In this article, we will explore the most important price action patterns every trader should know in 2026, how these patterns work, why they matter, and how traders can use them in real market conditions.
Why Price Action Patterns Still Matter in 2026
Financial markets have become more competitive, but the core principles of price movement have not changed. Human behavior still drives fear, greed, hesitation, optimism, and panic. Even in highly automated markets, price action patterns continue to emerge because they reflect repeated decision-making behavior. This is why classic chart formations remain useful even in modern trading environments.
In 2026, traders are dealing with a mix of global macro uncertainty, rapid sentiment shifts, algorithmic participation, and shorter attention cycles. Because of this, clean price action analysis has become even more important. It helps reduce noise. It trains traders to focus on structure instead of reacting emotionally to every headline. It also allows traders to identify high-probability setups with more confidence.
Price action patterns matter because they offer context. A candle by itself may not mean much, but when it forms at support, after a strong trend, during a pullback, or near a breakout level, it becomes meaningful. Context is what separates random chart watching from professional chart reading.
Test Your Price Action Pattern Skills
Answer 3 quick questions and see how well you know chart patterns.
A candle with a small body and a long lower wick near support is usually called:
When price breaks resistance and then comes back to test it before moving higher, this is:
A pattern formed by two failed attempts to break the same resistance zone is usually:
Understanding the Foundation of Price Action Trading
Before diving into specific patterns, it is important to understand what price action trading really involves. At its core, price action analysis studies the movement of price over time without depending too heavily on lagging indicators. Traders observe market structure, support and resistance, trend direction, volatility, candle behavior, and pattern formation.
A strong trend forms when price keeps making higher highs and higher lows in an uptrend, or lower highs and lower lows in a downtrend. A reversal often begins when that structure starts to weaken. Consolidation appears when neither buyers nor sellers are fully in control. Breakouts happen when price escapes a range or pattern with conviction.
Price action patterns are useful because they often appear at these critical moments. They can indicate trend continuation, loss of momentum, or the potential start of a reversal. The key is not just spotting the pattern, but understanding where it appears and what it suggests about the balance of power in the market.
The Pin Bar Pattern
The pin bar is one of the most widely followed price action patterns in trading. It is easy to recognize because it usually has a long wick and a small body. This structure shows that price moved strongly in one direction but was rejected before the candle closed. That rejection is what makes the pattern valuable.
A bullish pin bar often forms after a decline or near support. It shows that sellers pushed the market lower, but buyers stepped in and forced price back up. A bearish pin bar often appears after a rally or near resistance. In that case, buyers pushed price higher, but sellers regained control before the close.
In 2026, the pin bar remains relevant because it captures rejection clearly and quickly. However, traders should not treat every pin bar as a signal to enter immediately. The strongest pin bars form at important price zones, after an extended move, or in alignment with broader market structure. A pin bar in the middle of a noisy range is far less reliable than one appearing at a major support or resistance level.
The beauty of the pin bar is that it reflects failed aggression. One side tried to dominate but could not hold control. That failure often gives the other side an opening.
The Engulfing Candle Pattern
An engulfing pattern is another major price action signal that traders continue to rely on. It occurs when one candle fully covers or engulfs the body of the previous candle. A bullish engulfing pattern appears when a strong upward candle overtakes the prior bearish candle. A bearish engulfing pattern appears when a strong downward candle overtakes the prior bullish candle.
This pattern is powerful because it shows sudden strength and a potential shift in momentum. A bullish engulfing candle after a decline can suggest that buyers are taking control. A bearish engulfing candle after a rally can signal that sellers are stepping in with force.
In 2026, engulfing patterns are especially useful in volatile markets where sentiment changes quickly. Traders should look for these formations near turning points, key zones, or after exhaustion moves. When supported by volume, trend context, and market structure, an engulfing candle can become a high-quality signal.
What makes this pattern effective is the message it sends. It says that the previous candle’s direction has been overwhelmed. That sudden reversal in control is something traders should never ignore.
The Inside Bar Pattern
The inside bar is a classic price action setup that represents consolidation and temporary indecision. It happens when a candle forms completely within the high and low range of the previous candle. This tells traders that the market is pausing and compressing.
Although it may look simple, the inside bar can be extremely powerful. It often appears before strong moves, especially when it forms in trending markets. In an uptrend, an inside bar can signal that the market is resting before continuing higher. In a downtrend, it can indicate that sellers are pausing before another push lower.
The inside bar is especially useful in breakout trading. Traders often watch for price to break above or below the mother candle range. In 2026, with many assets experiencing sharp directional moves after periods of compression, the inside bar remains highly relevant for timing entries.
The key is to understand that an inside bar reflects reduced volatility. When volatility contracts, expansion often follows. Traders who recognize this shift early can position themselves for strong momentum moves.
The Breakout and Retest Pattern
Among all price action patterns, the breakout and retest setup is one of the most practical and reliable. It occurs when price breaks an important support or resistance level and then comes back to test that level before continuing in the breakout direction.
This pattern is valuable because it helps traders avoid false breakouts. Instead of chasing price as it breaks a level, they wait to see whether the market accepts the breakout. If old resistance becomes new support, or old support becomes new resistance, the pattern gains strength.
In 2026, breakout trading continues to attract attention because markets often move rapidly once key levels are broken. However, false breakouts remain common, especially in highly watched instruments. That is why the retest matters so much. It shows whether the breakout has real conviction.
The breakout and retest pattern is highly effective because it combines confirmation with opportunity. It gives traders a second chance to enter while also providing a logical area for risk management.
The Double Top and Double Bottom
Double tops and double bottoms remain some of the most recognized reversal patterns in technical analysis. A double top forms when price tests a resistance area twice and fails both times, often leading to a downside reversal. A double bottom forms when price tests support twice and holds, often leading to an upside reversal.
These patterns matter because they reflect exhaustion. In a double top, buyers try to push through resistance again but fail, showing weakening strength. In a double bottom, sellers fail to break support on the second attempt, showing that downside momentum may be fading.
In 2026, these patterns still matter because market participants continue to respond strongly to obvious price zones. Institutions, swing traders, and even retail traders watch major highs and lows closely. When the market fails twice at a level, it often attracts strong attention.
The most important part of trading these patterns is confirmation. Traders usually look for a break of the neckline or a clear shift in structure before acting. This reduces the risk of entering too early.
The Head and Shoulders Pattern
The head and shoulders pattern is one of the most respected reversal formations in chart analysis. It usually forms after an uptrend and consists of a left shoulder, a higher peak known as the head, and a right shoulder that fails to reach the same height as the head. The inverse head and shoulders pattern appears after a downtrend and signals a possible bullish reversal.
This pattern works because it shows a gradual loss of momentum. Buyers manage to push the market to a new high during the head, but they cannot sustain the move. By the time the right shoulder forms, the trend is no longer as strong as before. A break of the neckline then confirms that control may be shifting.
In 2026, the head and shoulders pattern remains relevant for swing traders and positional traders who want to catch larger reversals. It is particularly useful on higher time frames where market structure carries more meaning.
This pattern is not just about shape. It is about the story behind the shape. The market tries to keep going, fails to maintain strength, and then breaks structure. That sequence makes it powerful.
The Triangle Pattern
Triangle patterns are very important in price action trading because they reflect compression before expansion. There are several forms, including ascending triangles, descending triangles, and symmetrical triangles. Each carries slightly different implications, but all suggest that price is preparing for a larger move.
An ascending triangle usually forms when resistance stays relatively flat while support rises. This often suggests growing buying pressure. A descending triangle shows falling resistance into a flat support line, often indicating growing selling pressure. A symmetrical triangle reflects narrowing price action where both sides are waiting for a decisive breakout.
In 2026, triangle patterns are especially useful in markets where traders are waiting for macro triggers, earnings announcements, policy signals, or other catalysts. These formations allow traders to prepare in advance for a directional move.
The real value of triangles lies in the tightening structure. As price compresses, the market stores energy. Once price breaks out with conviction, the move can become very sharp. Traders who identify these setups early often gain a strong edge.
The Flag and Pennant Pattern
Flag and pennant patterns are continuation formations that usually appear after a strong impulsive move. A flag often looks like a small rectangular pullback channel against the trend. A pennant looks more like a small triangle after the initial surge. Both patterns suggest that the market is taking a brief pause before resuming the previous direction.
These patterns are important because they reflect controlled consolidation rather than weakness. In a bullish flag, price rises strongly, pauses in a slightly downward or sideways drift, and then breaks higher again. In a bearish flag, the opposite happens.
In 2026, traders continue to use flag and pennant patterns to stay aligned with strong momentum. These formations are especially effective in trending stocks, currencies, and commodities where institutional participation keeps the dominant move intact.
What makes them useful is their balance. They do not suggest chaos. They suggest orderly digestion of gains or losses. That often leads to cleaner continuation moves.
The False Breakout Pattern
One of the most important patterns every trader should understand is the false breakout. This happens when price breaks above resistance or below support but fails to continue and quickly reverses back inside the range. False breakouts trap traders who enter too late or too aggressively.
This pattern is critical in 2026 because modern markets often punish obvious entries. With so many traders watching the same levels, false moves can be common. Recognizing them can save traders from bad entries and also create opportunities in the opposite direction.
A false breakout above resistance often signals that buyers lacked follow-through. A false breakdown below support can show that sellers failed to maintain pressure. In both cases, the rejection itself becomes the signal.
Traders who understand false breakouts learn patience. Instead of reacting emotionally to every breakout, they wait for confirmation. That patience often separates disciplined traders from impulsive ones.
How to Use Price Action Patterns More Effectively
Knowing the names of patterns is not enough. The real skill lies in applying them with context and discipline. A price action pattern becomes more reliable when it forms at an important level, aligns with the broader trend, and fits the overall structure of the market.
Time frame matters. A pattern on a daily chart often carries more weight than the same pattern on a very short intraday chart. Trend matters as well. Continuation patterns tend to perform better in strong trends, while reversal patterns require more caution unless structure clearly supports them.
Risk management is equally important. Even the best-looking pattern can fail. Traders should define their invalidation point before entering a trade. They should also think in terms of probabilities, not certainty. The goal is not to predict every move perfectly. The goal is to take well-structured trades with controlled risk.
Patience also plays a major role. Many traders lose money not because they do not know patterns, but because they enter too early, ignore context, or chase weak setups. Good price action trading is built on selectivity.
Common Mistakes Traders Make with Price Action Patterns
One common mistake is forcing patterns where none exist. Traders sometimes become so eager to find setups that they start seeing shapes everywhere. This leads to poor decisions. A valid pattern should be clear, supported by context, and linked to a logical price zone.
Another mistake is ignoring the overall trend. A bullish signal inside a strong downtrend may fail unless there is broader evidence of reversal. Many traders also make the mistake of relying on one candle alone without considering what came before it.
Overtrading is another major issue. Because charts always contain movement, traders may feel tempted to act constantly. But price action works best when traders focus on clean, high-quality setups rather than frequent random trades.
Finally, many traders fail to review outcomes. Studying past trades helps identify which patterns work best in which environments. This ongoing learning process is essential for growth.
Why Traders in 2026 Need a Clean Chart Mindset
In a world filled with alerts, opinions, social media noise, and endless indicators, price action brings traders back to the core of market analysis. It encourages clarity. It teaches patience. It builds confidence based on observation rather than hype.
A clean chart mindset is especially important in 2026 because information overload can damage decision-making. Traders who simplify their process often find that they become more consistent. Instead of jumping between systems, they learn to trust structure, momentum, and context.
Price action patterns are not old-fashioned. They are timeless because they are rooted in market behavior. As long as markets move through supply and demand, these patterns will continue to matter.
Conclusion
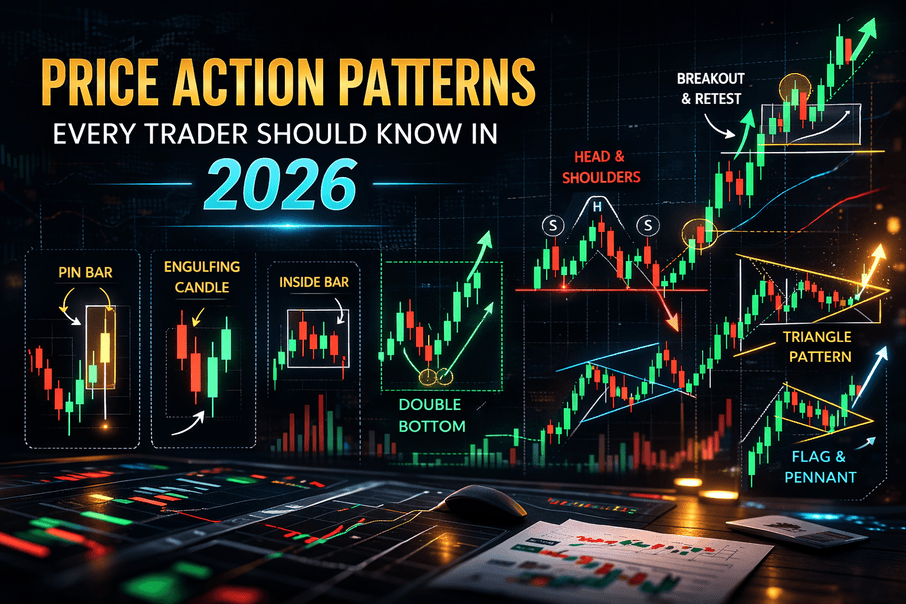
Price action patterns every trader should know in 2026 are not just chart shapes to memorize. They are practical signals that reveal how buyers and sellers are behaving in real time. Patterns like the pin bar, engulfing candle, inside bar, breakout and retest, double top, double bottom, head and shoulders, triangle, flag, pennant, and false breakout all offer valuable insight when used correctly.
The real advantage comes from understanding the meaning behind the pattern. Traders who combine pattern recognition with market structure, support and resistance, trend context, and risk control are far more likely to make disciplined decisions. Price action trading continues to stand out because it strips away unnecessary complexity and focuses on what the market is actually doing.
