Price action trading remains one of the most trusted methods in financial markets because it focuses on what matters most: the movement of price itself. While many retail traders rely heavily on indicators, professional traders often pay closer attention to raw market structure, candle behavior, momentum shifts, and the relationship between price and key levels. This is why the most reliable price action trading patterns continue to attract traders across stocks, forex, commodities, and indices.
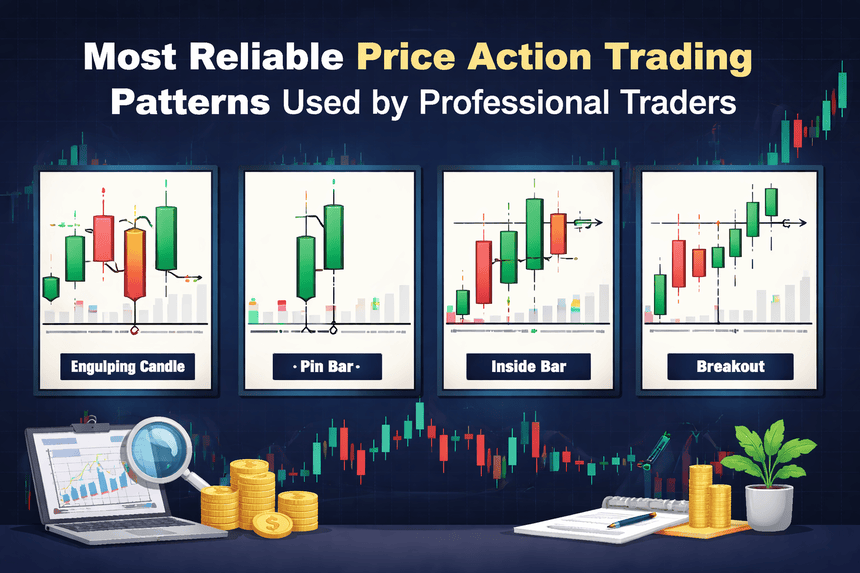
The appeal of price action is simple. It removes unnecessary clutter and helps traders understand how buyers and sellers are behaving in real time. Instead of depending only on lagging signals, professionals study whether a market is rejecting a zone, pausing before continuation, or gathering energy for a breakout. Within this approach, certain patterns stand out again and again because they reflect repeated market psychology. Among the most reliable are engulfing candles, pin bars, inside bars, and breakout structures.
These patterns are not magic formulas. Their reliability comes from context, timing, and discipline. A bullish engulfing candle near strong support does not mean the same thing as the same candle forming in the middle of a random sideways market. A pin bar rejecting a major weekly level carries more weight than one appearing without any structural significance. Professionals understand this difference. They do not trade patterns in isolation. They trade patterns within a broader framework that includes trend, liquidity, support and resistance, volatility, and risk management.
This article explains the most reliable price action trading patterns used by professional traders and how these setups can be applied more effectively. By the end, you will have a clearer understanding of why these patterns work, when they fail, and how traders use them to build consistent decision-making in live markets.
Why Professional Traders Trust Price Action
Professional traders trust price action because price reflects every known factor in the market. News, expectations, fear, greed, positioning, and liquidity all eventually appear in the chart. Instead of trying to predict every external event, many experienced traders focus on how the market reacts.
This reaction is important because markets are not moved by information alone. They are moved by how participants interpret that information. A company may report strong earnings, yet the stock falls because expectations were even higher. An economy may release weak data, yet an index rises because traders had already priced in worse results. Price action helps traders observe this real-time response.
Another reason professionals respect price action is that it works across timeframes. A swing trader on the daily chart and an intraday trader on the fifteen-minute chart both study candles, breakouts, rejections, and structure. The principle stays the same even if the holding period changes.
Price action also supports disciplined risk management. Since patterns form around visible levels, traders can often define entries, stop losses, and targets more clearly. This clarity improves consistency and makes it easier to manage risk over time.
Understanding Market Context Before Trading Any Pattern
Before studying individual setups, it is essential to understand that context matters more than pattern names. A professional trader first asks where the market is trading, what the broader trend is, and whether price is approaching an important area.
If the market is in a strong uptrend, bullish continuation patterns often have a higher success rate than countertrend reversal patterns. If the market is range-bound, breakouts may fail more often unless supported by volume and follow-through. If price is approaching a major support or resistance zone, reversal candles may become more meaningful.
Market context includes trend direction, higher timeframe structure, momentum, session behavior, and the location of liquidity. It also includes whether the market is quiet or volatile. A breakout during a low-volume session may be less reliable than one that occurs when participation expands. A pin bar at a random level may fail quickly, while the same shape rejecting a major weekly resistance zone may mark an important turning point.
This is one of the biggest differences between amateur and professional trading. Retail traders often see a candle pattern and enter immediately. Professionals first study the environment in which that pattern appears.
Engulfing Candles and Why They Matter
Among the most reliable price action trading patterns, engulfing candles are widely respected because they show a strong shift in control between buyers and sellers. A bullish engulfing candle forms when a down candle is followed by a larger up candle that fully covers or overwhelms the previous candle’s body. A bearish engulfing candle is the opposite, where selling pressure overtakes the prior bullish session.
The importance of an engulfing candle lies in what it represents psychologically. A bullish engulfing pattern shows that sellers were initially in control, but buyers stepped in with enough force to erase that weakness and close strongly. That kind of reversal in momentum is meaningful, especially near support or after a pullback in an uptrend. A bearish engulfing candle shows the opposite and can signal that buyers are losing control near resistance or after an exhausted rally.
Professional traders often look for engulfing candles at key levels rather than in the middle of noise. For example, if a stock pulls back into a rising support zone and prints a bullish engulfing candle, that can suggest that institutional buyers are defending the trend. If an index rallies into a major resistance area and forms a bearish engulfing candle, that may signal distribution or profit-taking.
The strength of this pattern increases when the engulfing candle closes decisively, breaks a recent swing point, or appears after a period of weak countertrend movement. Professionals also pay attention to the size of the candle. A strong engulfing candle often reflects conviction. However, an excessively large candle can sometimes create poor risk-reward if the stop loss becomes too wide.
Engulfing candles are most effective when used with structure. A trader might wait for the engulfing pattern, then look for confirmation through a break of the candle high in a bullish setup or the candle low in a bearish one. This extra patience can help avoid false signals.
Pin Bars and the Power of Rejection
Pin bars are another classic pattern used by professional traders. A pin bar is a candle with a small body and a long wick, showing rejection of a certain price area. A bullish pin bar usually has a long lower wick and suggests that sellers pushed the market down but buyers rejected those lower prices and forced a close back higher. A bearish pin bar has a long upper wick and suggests rejection of higher prices.
The reason pin bars are effective is that they reveal a failed attempt by one side of the market. When price probes beyond a key level and quickly reverses, it often means the breakout lacked commitment or ran into strong opposing orders. This rejection can create high-quality opportunities, especially at important levels.
A bullish pin bar near support can show that bears attempted a breakdown but failed. A bearish pin bar near resistance can show that bulls tried to continue higher but could not sustain the move. Professionals often use pin bars to identify reversals, fake breakouts, and entries in line with the broader trend after a pullback.
What makes a pin bar more reliable is its location and structure. The wick should clearly stand out from surrounding candles, and the body should be relatively small. The longer the rejection wick relative to the candle body, the stronger the message can be. However, not every long wick is tradable. The candle should appear at a logical place in the chart, such as prior support, prior resistance, a trendline interaction, or a major moving market zone.
Professionals also consider whether the pin bar rejects a liquidity sweep. For instance, price may briefly move above a previous swing high, trigger breakout buyers and stop losses, then reverse sharply and close back below the level. That bearish pin bar can be highly significant because it traps late buyers and shifts sentiment quickly.
Inside Bars and Controlled Consolidation
Inside bars are often underestimated by new traders, but professionals value them because they reflect contraction, balance, and the potential for expansion. An inside bar forms when a candle’s high and low remain fully within the range of the previous candle. This pattern suggests temporary consolidation after a strong move or pause at a critical point.
The inside bar is powerful because markets alternate between expansion and contraction. Strong moves rarely continue in a straight line forever. They pause, compress, and then either continue or reverse. The inside bar captures that compression phase. It shows that volatility has narrowed and that the market is deciding on its next move.
Professional traders often use inside bars in trending markets. In an uptrend, an inside bar after a strong bullish candle can act as a continuation setup. If price breaks above the mother candle high, the trend may resume. In a downtrend, an inside bar can signal bearish continuation if price breaks lower.
This pattern is also useful near breakout zones. If a market rallies toward resistance, pauses with one or more inside bars, and then breaks strongly, that can be a sign of building pressure. Likewise, in ranges, inside bars can hint at indecision, which is why context again becomes critical.
The best inside bars usually form after a meaningful impulse candle or at a key technical zone. Traders often place entry orders above or below the mother candle range depending on directional bias. Some wait for the actual breakout close for added confirmation.
One of the reasons professionals like inside bars is that they often allow tighter stop placement. Since the range is well-defined, traders can build structured risk around it. Still, false breakouts do occur, especially in choppy conditions. That is why inside bars work best when aligned with the higher timeframe trend or an obvious structural theme.
Price Action Pattern Explorer
Select a trading pattern to understand what it signals and why professional traders watch it closely.
Engulfing Candle
An engulfing candle shows a strong shift in momentum. In a bullish engulfing pattern, buyers completely overpower the previous bearish candle. In a bearish engulfing pattern, sellers take control after prior buying pressure.
What it tells traders: This pattern often signals a reversal or a strong continuation move when it appears near important support or resistance zones.
Professional view: Traders usually trust this setup more when it forms after a pullback, at a major level, and with a strong closing body.
Breakout Structures and Momentum Expansion
Breakout structures are among the most widely traded price action patterns in professional trading because markets often experience major directional moves after breaking important levels. A breakout occurs when price moves beyond a clear area of support, resistance, consolidation, or chart structure. However, not every breakout is worth trading.
Professionals distinguish between clean breakouts and emotional or weak breakouts. A strong breakout is usually supported by momentum, broad candle closes, expansion in range, and continued follow-through after the break. It often comes after a period of compression, repeated testing of a level, or a well-defined base. A weak breakout may poke above or below a level briefly and then reverse, trapping impatient traders.
Breakout trading works because many market participants cluster their decisions around visible levels. Stop losses, breakout entries, and pending orders often build near support and resistance. When price breaks through these zones, those orders can accelerate movement. This creates an environment where momentum expands quickly.
Professional traders often watch for breakout structures such as horizontal range breaks, ascending triangle breaks, descending triangle breaks, and trend continuation breaks after consolidation. They usually want to see that the market has respected the level several times before the breakout. The more obvious and meaningful the level, the more likely it is to attract participation.
Some professionals enter immediately on the break if momentum is strong. Others prefer a retest, where price breaks the level, returns to test it from the other side, and then continues. The retest approach can reduce false entries and improve risk-reward. It also allows the trader to confirm that the old resistance has become support or the old support has become resistance.
The major challenge with breakout trading is false breakouts. Markets often move beyond a level, trigger entries, and then reverse sharply. Professionals manage this risk by looking for quality structure, waiting for a strong close, using volume when available, and studying whether the breakout occurs in the direction of the dominant trend.
Why These Patterns Are Considered High Probability
Engulfing candles, pin bars, inside bars, and breakout structures are considered high probability not because they always work, but because they reflect important shifts in order flow and trader behavior. Each pattern captures a different market condition.
Engulfing candles show decisive takeover by buyers or sellers. Pin bars show rejection and failed attempts at continuation. Inside bars show contraction and preparation for expansion. Breakouts show release of pressure and potential momentum acceleration.
These patterns become high probability when they appear at meaningful areas and align with the broader market story. Professionals do not rely only on shape recognition. They combine pattern reading with trend analysis, support and resistance, multiple timeframe review, and disciplined execution.
Another reason these patterns remain reliable is that they are rooted in recurring human behavior. Fear, greed, hesitation, and conviction do not disappear from markets. As long as traders and institutions continue to react to price levels and liquidity, these patterns will continue to appear.
How Professional Traders Filter Bad Setups
One of the most valuable lessons from professional trading is that success often comes more from avoiding poor setups than from finding perfect ones. A trader can know every price action pattern and still lose consistently if they ignore context.
Professionals avoid taking patterns in low-quality environments. They are cautious when markets are choppy, directionless, or reacting unpredictably to major news. They do not force trades simply because a candle looks interesting. They wait for alignment.
They also study timeframe relationships. A bullish pin bar on a lower timeframe may have little value if the daily chart is pressing into major resistance. Likewise, a breakout on a short timeframe may fail if it runs directly into a strong higher timeframe supply zone.
Patience is a major filter. Many poor trades happen because traders anticipate confirmation rather than waiting for it. A professional may see an inside bar forming but wait for the actual break. They may notice a bearish engulfing candle but avoid shorting unless the next session confirms weakness.
Risk management is another filter. Even a strong setup can be skipped if the stop loss required is too large relative to the potential reward. Professionals think in terms of expected return, not just signal quality.
Combining Price Action With Trading Discipline
Price action trading patterns are only useful when supported by discipline. Professional traders know that no pattern can overcome emotional decision-making, poor sizing, or lack of planning. A strong setup still requires patience in entry, clarity in stop placement, and realism in target selection.
Discipline includes accepting that losing trades are part of the process. Even the most reliable price action trading patterns fail sometimes. A bullish engulfing candle can be invalidated by sudden news. A pin bar can be overwhelmed by trend pressure. An inside bar breakout can turn into a false move. A breakout structure can trap traders before reversing.
What keeps professionals consistent is not perfect prediction. It is the ability to follow a repeatable framework. They define what they want to see, wait for it, manage their risk, and review outcomes honestly. Over time, this process matters far more than any single trade.
Final Thoughts on the Most Reliable Price Action Trading Patterns
The most reliable price action trading patterns used by professional traders continue to stand the test of time because they reveal how markets actually behave. Engulfing candles highlight decisive reversals in control. Pin bars reveal rejection and failed moves. Inside bars capture consolidation before expansion. Breakout structures show when pressure is finally released and momentum enters the market.
These patterns are not powerful because of their names alone. They are powerful because they reflect real shifts in market psychology. When combined with strong chart context, higher timeframe structure, and disciplined risk management, they can become highly effective tools for traders seeking clearer, more logical decisions.
For anyone using WordPress to publish trading content, this topic also has strong educational value because it speaks to both beginners and serious traders. It offers practical insight, timeless relevance, and strong user engagement potential. Readers are naturally drawn to chart patterns because they are visual, actionable, and directly connected to live market behavior.
