Candlestick patterns are crucial tools in technical analysis, providing insights into market sentiment and potential price movements. Each pattern reveals different aspects of market behavior, offering traders valuable signals for making informed decisions. This article explores the most reliable candlestick patterns, including their characteristics, historical significance, and practical applications.
Understanding Candlestick Charts
Candlestick charts originated in Japan during the 18th century and were popularized in the West by Steve Nison in the 1990s. They represent price movements over specific periods, showing the open, high, low, and close prices for each time frame. Each candlestick consists of a body and wicks (or shadows), with:
- Body: The colored part of the candlestick, shows the range between the open and close prices.
- Wicks/Shadows: The lines above and below the body, indicate the highest and lowest prices during the period.
Green Candles: Indicate that the closing price is higher than the opening price, signifying bullish sentiment. Red Candles: Indicate that the closing price is lower than the opening price, signifying bearish sentiment.
Candlestick charts are favored for their visual clarity, allowing traders to quickly assess market conditions and identify patterns.
History and Evolution
Candlestick charting has ancient roots in Japan, where rice traders used these charts to analyze market trends and make trading decisions. Munehisa Homma, a Japanese rice trader in the 18th century, is credited with developing the early candlestick patterns based on market psychology. The concept was later introduced to Western traders, becoming a fundamental part of modern technical analysis.
Most Reliable Candlestick Patterns
Bullish Candlestick Patterns
1. Three White Soldiers
Pattern Description: Three consecutive tall green candles, each closing near the high of the previous candle. The candles should have little or no shadow at the bottom and overlap slightly.
Signal: Indicates a strong bullish reversal from a downtrend to an uptrend.
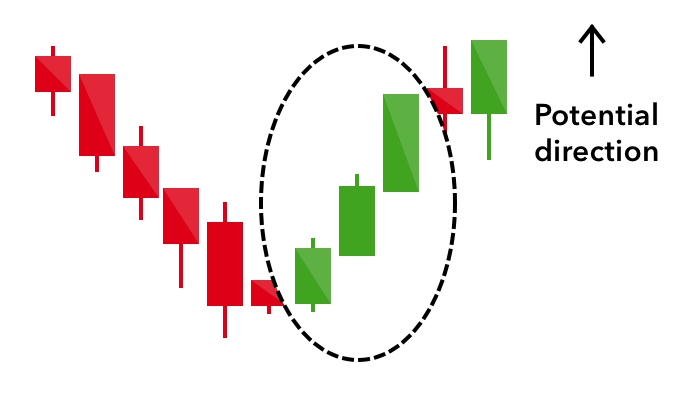
Image Description: Three tall, green candles with each closing near the high of the previous candle.
2. Deliberation
Pattern Description: Two tall green candles followed by a small green candle. The small candle opens near the close of the previous tall green candle, indicating consolidation before a potential continuation.
Signal: Suggests that the current uptrend is likely to continue.
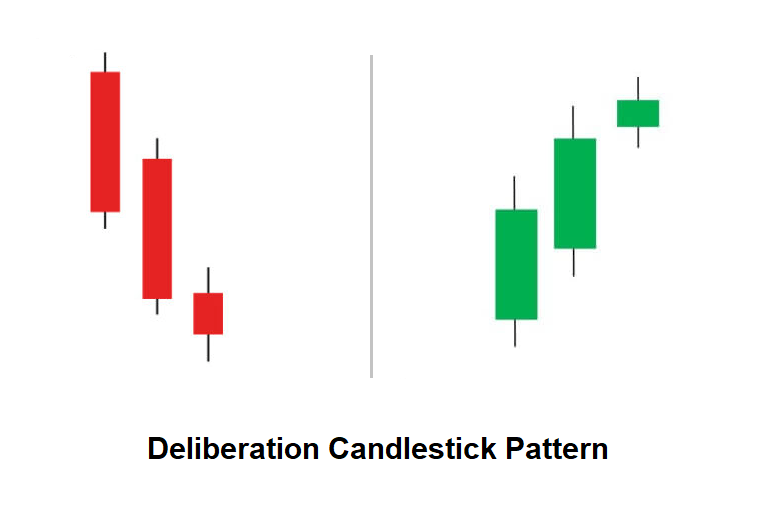
Image Description: The first two candles are tall and green with a third small green candle opening close to the previous close.
3. Morning Star
Pattern Description: A three-candle pattern: a long red candle, followed by a small candle (which can be red or green) with a gap down from the first candle, and a long green candle that closes above the midpoint of the first candle.
Signal: Indicates a potential reversal from a downtrend to an uptrend.
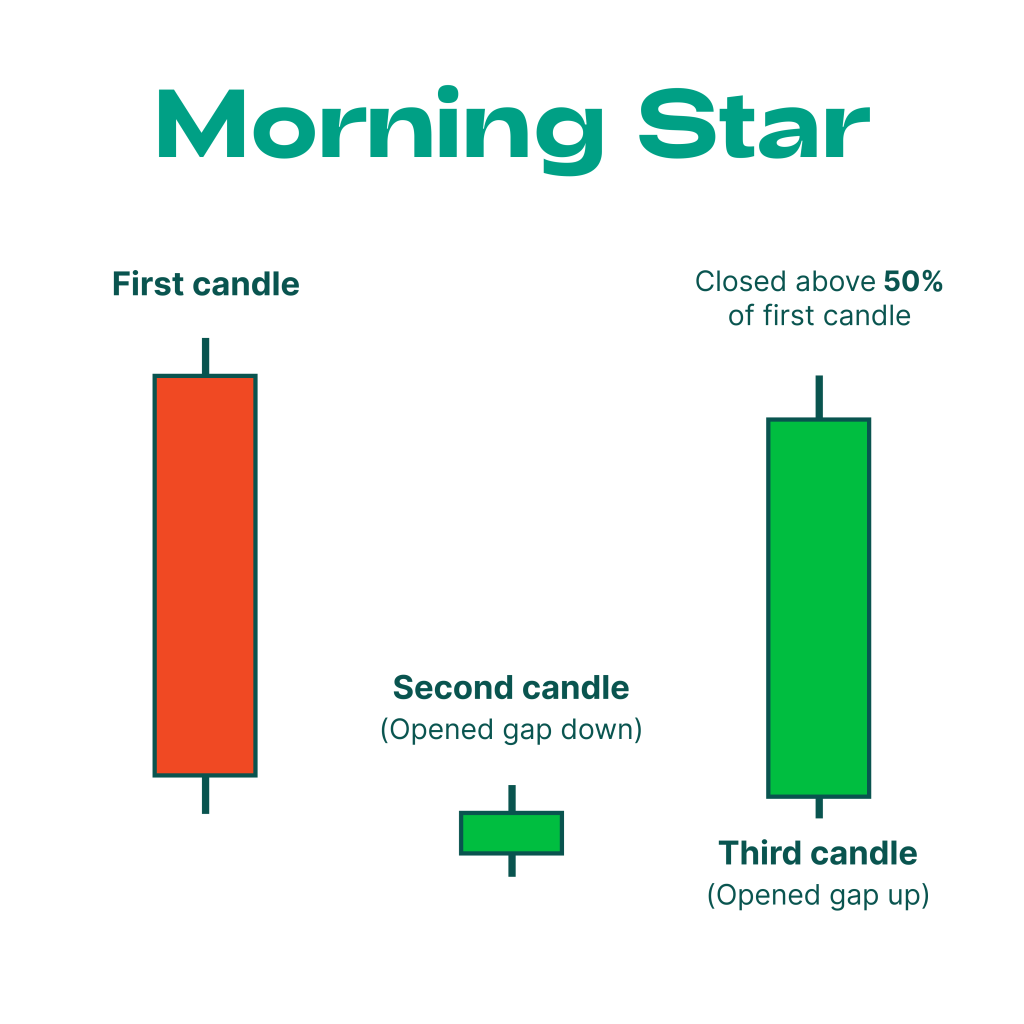
Image Description: The pattern starts with a long red candle, and a small gap, and concludes with a long green candle closing above the midpoint of the first candle.
Bearish Candlestick Patterns
4. Three Black Crows
Pattern Description: Three consecutive tall red candles where each candle opens within the previous candle’s body and closes near the low.
Signal: Indicates a strong bearish reversal from an uptrend to a downtrend.
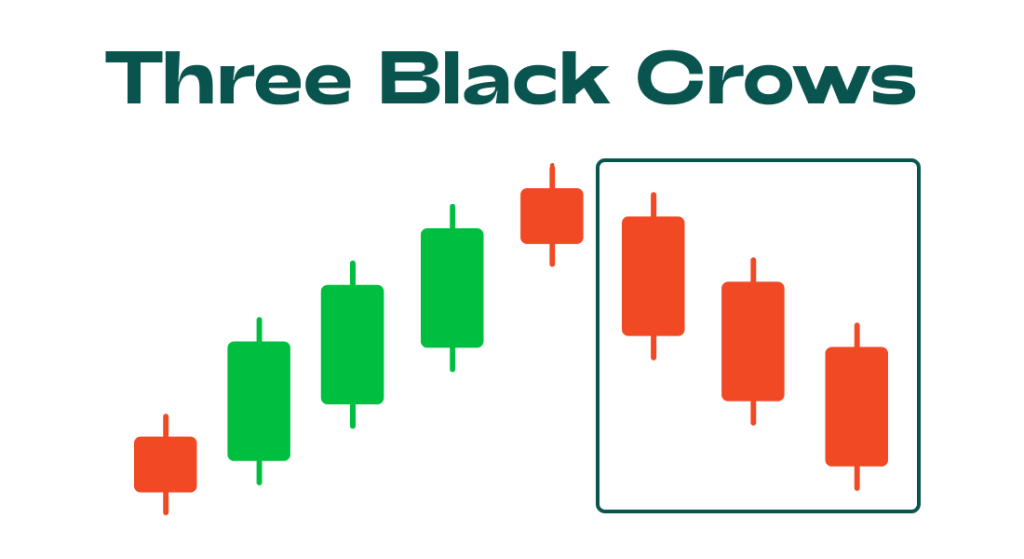
Image Description: Three tall, red candles each closing near the low of the previous candle.
5. Identical Three Crows
Pattern Description: Similar to the Three Black Crows but with three red candles that are identical in size and shape, with no overlapping bodies.
Signal: Indicates a strong bearish reversal.
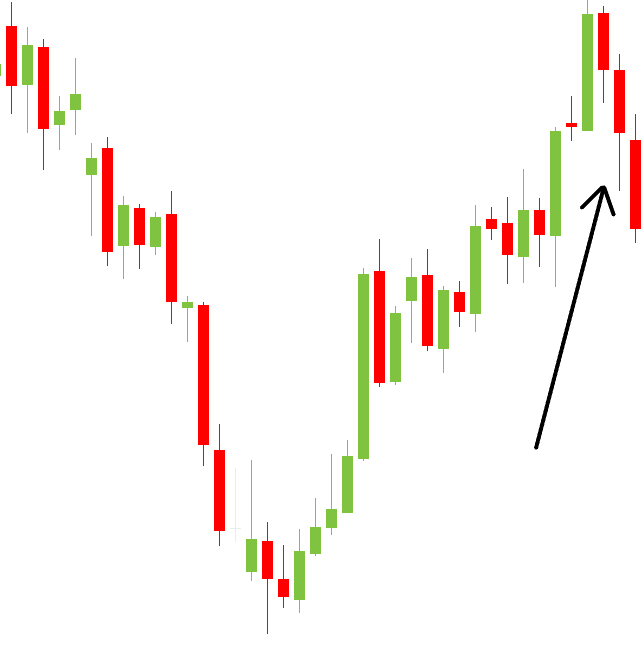
Image Description: Three identical red candles with no overlap, each closing near the low.
6. Evening Star
Pattern Description: A three-candle pattern: a long green candle, followed by a small candle (which can be red or green) with a gap up from the first candle, and a long red candle that closes below the midpoint of the first candle.
Signal: Suggests a reversal from an uptrend to a downtrend.
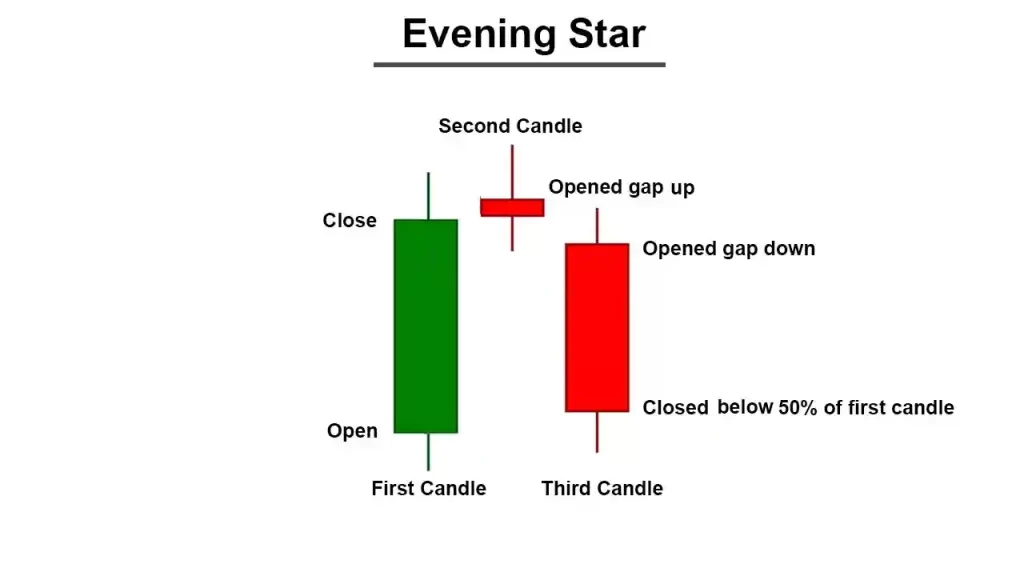
Image Description: The pattern begins with a long green candle, a small gap up, and ends with a long red candle closing below the midpoint of the first candle.
7. Concealing Baby Swallow
Pattern Description: A four-candle pattern: two tall red candles with no shadows, followed by a third red candle with a tall upper shadow, and a fourth red candle that engulfs the previous candle.
Signal: Indicates a strong continuation of a bearish trend.
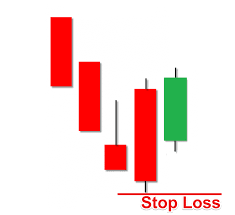
Image Description: The pattern features two tall red candles, a third with a tall upper shadow, and a fourth candle engulfing the previous.
8. Three-Line Strike
Pattern Description: A four-candle pattern: three rising green candles followed by a fourth red candle that opens above the third green candle’s close and closes below the first green candle’s opening.
Signal: Indicates a potential reversal from an uptrend to a downtrend.
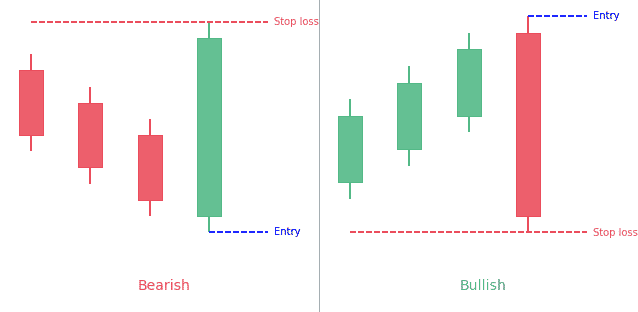
Image Description: Three green candles form an uptrend, followed by a red candle that engulfs the previous three.
Applications and Practical Uses
Candlestick patterns are used in various trading strategies and can be applied to different time frames, from minutes to months. Traders use these patterns to:
- Identify Trends: Patterns help determine whether a trend is continuing or reversing.
- Spot Entry and Exit Points: Patterns indicate optimal times to enter or exit trades.
- Confirm Signals: Patterns are often used in conjunction with other technical indicators to confirm signals and reduce false positives.
Understanding and applying these patterns effectively requires practice and experience. Traders often combine candlestick patterns with technical analysis tools like moving averages, RSI, and MACD to enhance their decision-making process.
