Day trader charts are indispensable tools for anyone involved in intraday trading. These charts help traders analyze market movements, identify trends, and make informed decisions in real-time. Understanding how to use day trader charts effectively can significantly enhance your trading strategies and improve your chances of success in the fast-paced world of day trading.
Understanding the Basics of Day Trader Charts
Day trader charts are visual representations of market data over specific time intervals. These charts display the price movement of a financial instrument, such as stocks or currencies, and are crucial for day traders who need to make quick decisions based on market fluctuations.
There are several types of day trader charts, each serving a unique purpose:
- Line Charts: Line charts connect the closing prices of a financial instrument over a specific period. While simple, they provide a clear overview of the general price movement, making them useful for identifying long-term trends.
- Bar Charts: Bar charts provide more detailed information by showing the opening, closing, and high, and low prices for each period. This type of chart is excellent for analyzing daily price ranges and identifying potential entry and exit points.
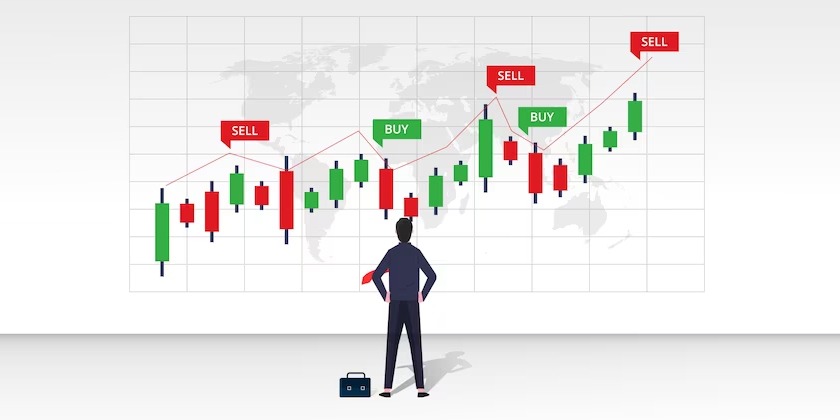
- Candlestick Charts: Candlestick charts are perhaps the most popular among day traders. They offer a visual representation of market sentiment by displaying the open, high, low, and close prices within a specific period. The “body” of the candlestick shows the range between the open and close, while the “wicks” or “shadows” represent the high and low prices.
Choosing the Right Time Frame
The time frame you select for your day trader charts can greatly impact your trading strategy. Common time frames include:
- 1-Minute Chart: Ideal for scalping, where traders make multiple trades within a short period.
- 5-Minute Chart: Popular for short-term trading, offering a balance between speed and detail.
- 15-Minute Chart: Useful for capturing broader intraday trends without getting lost in the noise.
- 30-Minute and 60-Minute Charts: These longer time frames help traders see the bigger picture and are often used in conjunction with shorter time frames to confirm trends.
How to Analyze Day Trader Charts
Effective analysis of day trader charts involves recognizing patterns and understanding indicators:
- Support and Resistance Levels: These are key price levels where the market tends to reverse or consolidate. Identifying these levels on your day trader charts can help you make informed trading decisions.
- Moving Averages: Moving averages smooth out price data to help you identify the direction of the trend. Commonly used moving averages include the 50-day and 200-day moving averages.
- Relative Strength Index (RSI): The RSI is a momentum indicator that measures the speed and change of price movements. It helps determine whether a stock is overbought or oversold.
- Bollinger Bands: These bands consist of a moving average and two standard deviations above and below it. They help traders identify volatility and potential price reversals.
Tools and Platforms for Day Trader Charts
Several tools and platforms can enhance your chart analysis:
- TradingView: A popular charting platform that offers a wide range of customizable charts and indicators.
- MetaTrader 4/5: Widely used by forex and CFD traders, this platform provides advanced charting tools and technical analysis.
- Thinkorswim: Provided by TD Ameritrade, this platform is known for its comprehensive charting capabilities and user-friendly interface.
Strategies Using Day Trader Charts
To succeed in day trading, you need to apply strategies that leverage the insights gained from day trader charts:
- Breakout Strategy: This strategy involves identifying key support or resistance levels and placing trades when the price breaks through these levels, signaling a potential trend continuation.
- Reversal Strategy: Traders look for signals of a trend reversal, such as candlestick patterns or divergence in RSI, to take advantage of price corrections.
- Momentum Trading: This strategy focuses on trading in the direction of strong market momentum, often using indicators like the RSI or moving averages to confirm the trend.
Conclusion
Mastering day trader charts is a crucial skill for anyone serious about intraday trading. By understanding the different types of charts, choosing the right time frames, and applying effective analysis techniques, you can improve your trading decisions and increase your profitability. Remember, day trader charts are not just tools—they are the foundation of a successful trading strategy. Whether you are a beginner or an experienced trader, continuously refining your chart analysis skills will keep you ahead in the competitive world of day trading.
