Market timing has always been one of the most difficult parts of trading and investing. Every investor wants to know when to enter, when to exit, when to stay patient, and when to protect capital. Yet markets rarely move in a straight line. A stock may look strong on fundamentals but fail to move for months. An index may appear overbought on charts but continue rising. A commodity may break resistance, trap late buyers, and then reverse sharply. This is why market timing remains a major challenge even for experienced traders.
In traditional finance, traders often depend on chart-based trading signals. These include support and resistance, moving averages, RSI, MACD, candlestick patterns, volume breakouts, trendlines, and price action setups. These tools help traders understand what the market is doing through price, momentum, and participation. They are useful because they are visible, measurable, and widely followed.
However, chart-based signals usually react to what has already happened. A breakout appears only after price moves above a level. A moving average crossover appears only after a trend has already started. An RSI divergence appears only after momentum has already slowed. These tools help traders confirm price behavior, but they do not always explain why the timing of a move develops at a particular moment.
This is where financial astrology offers a different perspective. Market timing with astrology studies planetary cycles, lunar phases, eclipses, retrogrades, and long-term cosmic patterns to identify possible windows of volatility, trend reversal, expansion, fear, panic, or optimism. It does not replace technical analysis, but it can add a timing layer that helps traders prepare before major turning points become visible on charts.
The debate between astrology-based timing and chart-based trading signals is not about choosing one system and rejecting the other. The more practical question is how both methods can work together. Technical analysis shows the structure of price. Financial astrology studies the rhythm of time. When both point toward the same market window, traders may gain a stronger framework for decision-making.
What Is Market Timing with Astrology?
Market timing with astrology is the study of planetary movements and their possible relationship with financial market cycles. The idea is that markets are not only driven by earnings, interest rates, liquidity, inflation, and investor behavior, but also by time cycles that influence collective psychology. Since markets are ultimately shaped by human emotion, fear, greed, confidence, confusion, and panic, astrology attempts to track the timing of these emotional shifts through planetary symbolism.
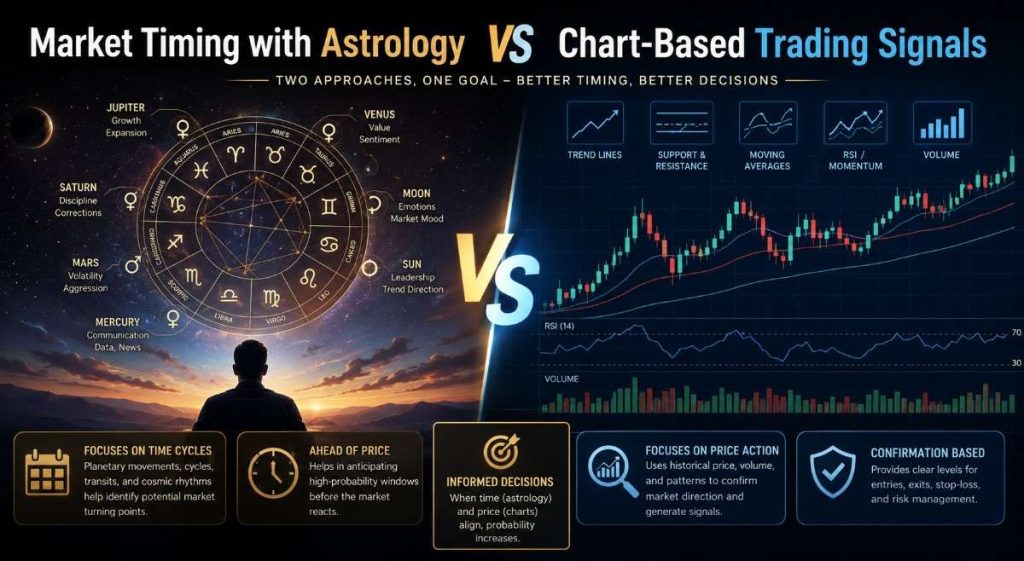
In financial astrology, the Sun often represents authority, leadership, gold, government policy, and broad market visibility. The Moon reflects public mood, sentiment, liquidity fluctuations, and short-term emotional movement. Mercury is linked with communication, data, technology, trading activity, and market rumors. Venus may reflect luxury, banking, consumer confidence, and value perception. Mars represents aggression, volatility, risk appetite, conflict, and sudden price action. Jupiter is associated with expansion, optimism, growth, liquidity, and speculation. Saturn represents discipline, fear, debt, contraction, regulation, delays, and corrections. Uranus is connected with disruption, technology, shocks, and unexpected reversals. Neptune can reflect confusion, bubbles, illusion, speculation, and unclear valuation. Pluto is often linked with deep transformation, crisis, power, debt cycles, and structural resets.
Astrology-based timing does not claim that one planetary transit will always produce the same market result. Instead, it studies patterns, historical repetitions, and probability windows. For example, a stressful Mars-Saturn aspect may not automatically cause a crash, but it may create an environment where markets become more cautious, defensive, or volatile. A strong Jupiter cycle may not guarantee a rally, but it may support risk appetite when liquidity and technical structure also agree.
This makes financial astrology more useful as a timing filter than as a standalone prediction machine. It helps traders ask better questions. Is the market entering a high-volatility window? Are investors likely to become more cautious? Is a euphoric phase becoming risky? Is a trend nearing exhaustion? Could a reversal develop near a specific date? These questions can improve preparation, especially when used with price confirmation.
What Are Chart-Based Trading Signals?
Chart-based trading signals come from technical analysis. They use historical price, volume, volatility, and momentum to understand current market behavior. Traders study charts because price reflects the combined actions of buyers and sellers. When demand is stronger than supply, price rises. When supply is stronger than demand, price falls. Technical analysis tries to identify these shifts early enough to create profitable trades.
A moving average crossover is one common signal. When a short-term moving average crosses above a long-term moving average, traders may see it as a bullish sign. When it crosses below, they may see it as bearish. RSI helps measure whether an asset is overbought or oversold. MACD tracks trend momentum. Bollinger Bands show volatility expansion and contraction. Support and resistance levels show where price has previously reacted. Candlestick patterns show short-term shifts in buyer and seller control.
Chart-based signals are popular because they create structure. A trader can define entry, stop loss, and target levels. A breakout trader may buy when price moves above resistance. A mean reversion trader may buy when price returns to support. A trend follower may stay in a trade as long as price remains above a moving average. These systems bring discipline into trading.
However, technical signals can fail. Breakouts can become fakeouts. Oversold markets can become more oversold. A stock can remain overbought during a powerful rally. Moving average crossovers can lag badly in choppy markets. Price action can become noisy during news events, central bank meetings, earnings releases, geopolitical shocks, or liquidity stress.
This is why chart-based trading works best when traders understand context. A signal by itself is not enough. The quality of the signal depends on trend direction, volume confirmation, macro backdrop, volatility regime, market breadth, sector rotation, and timing. Financial astrology can add another form of context by identifying periods when a technical setup may become more meaningful.
Market Timing with Astrology vs Chart-Based Trading Signals
Explore how financial astrology, technical analysis, and chart-based trading signals can work together to improve market timing, risk awareness, and trading decisions.
Market timing with astrology is the study of planetary cycles, lunar phases, retrogrades, eclipses, and other cosmic patterns to identify possible market turning points. It does not replace technical or fundamental analysis. Instead, it helps traders understand when markets may become more sensitive to volatility, fear, optimism, or trend reversals.
Chart-based trading signals focus on price, volume, momentum, support, resistance, moving averages, and indicators such as RSI or MACD. Astrology-based timing focuses on time cycles and market psychology. Charts show what price is doing, while astrology attempts to identify when a market may enter an important timing window.
Astrology should not be treated as a tool for guaranteed predictions. It is better used as a probability-based timing framework. A planetary cycle may suggest higher volatility, stronger sentiment, or a possible reversal window, but traders should always confirm the signal through price action, market structure, and risk management.
Technical analysis is more widely accepted because it uses visible price and volume data. However, technical indicators can lag and may produce false signals. Financial astrology adds a timing layer that can help traders prepare for sensitive market periods. The strongest approach is often to combine both methods rather than depend on only one.
Traders can first identify important astrological timing windows, such as retrograde stations, eclipses, Mars aspects, or Jupiter-Saturn cycles. Then they can check charts for confirmation through support, resistance, breakouts, breakdowns, trendlines, volume, or momentum indicators. When time and price align, the trading setup may become more meaningful.
Chart-based signals can fail because markets are influenced by many factors, including news, earnings, interest rates, liquidity, geopolitical events, and investor psychology. A breakout may become a false breakout, or an oversold market may continue falling. This is why traders need confirmation, position sizing, and stop-loss discipline.
Financial astrologers often study the Sun, Moon, Mercury, Venus, Mars, Jupiter, Saturn, Uranus, Neptune, and Pluto. For example, Mercury may relate to communication and trading activity, Mars to volatility, Jupiter to expansion, Saturn to caution, and Uranus to sudden market surprises. The meaning depends on the asset, market cycle, and overall planetary context.
Yes, financial astrology can help traders identify periods when markets may become more volatile or uncertain. During such windows, traders may reduce leverage, tighten stop losses, avoid emotional entries, or wait for stronger confirmation. It should support risk planning, not replace disciplined trading rules.
Astrology can be used by both traders and investors, but the time frame must match the strategy. Short-term traders may study lunar phases and fast-moving planetary aspects, while long-term investors may focus on Saturn, Jupiter, Uranus, eclipses, and broader market cycles. The key is to align the timing method with the trading or investment horizon.
Beginners should first understand basic chart signals, support and resistance, trend direction, risk management, and position sizing. After building a strong foundation, they can use astrology as an additional timing layer. This balanced approach helps avoid emotional decisions and improves the quality of market analysis.
The Core Difference Between Astrology and Chart Signals
The key difference between market timing with astrology and chart-based trading signals is that astrology focuses on time, while technical analysis focuses on price. Astrology asks when the market may become sensitive. Technical analysis asks what price is doing now. Astrology tries to identify possible turning windows before price confirms them. Chart signals usually confirm a move after market behavior changes.
For example, a trader may see that a major index is approaching resistance. Technical analysis shows the level where sellers may appear. Astrology may show that the same week includes a difficult Mars aspect, a Mercury retrograde station, or a lunar eclipse. The technical chart shows where price may react. Astrology suggests when the reaction may become more likely. If price then rejects resistance with high volume, the trader receives confirmation from both time and price.
This does not mean astrology is always early or charts are always late. Each method has strengths and weaknesses. Astrology can warn about timing windows, but it may not give exact price levels. Technical analysis gives price levels, but it may not explain why a reversal happens at a certain time. Astrology may help traders prepare emotionally and strategically. Charts help traders execute with discipline.
The most effective approach is not astrology versus charts. It is astrology plus charts. Time windows without price confirmation can lead to premature trades. Chart patterns without timing awareness can lead to false signals. When both tools align, traders can improve the quality of their decision-making.
Why Chart-Based Signals Can Lag
Chart-based trading signals often lag because they depend on historical price data. A moving average is calculated from past prices. A crossover happens only after price has already moved enough to shift the average. Momentum indicators also depend on previous price changes. Even breakout signals need price to cross a level before the signal appears.
This lag is not always bad. In fact, confirmation can protect traders from guessing. A disciplined trader waits for evidence instead of predicting blindly. However, lag becomes a problem when markets move quickly. In fast corrections, the signal may appear after much of the move has already happened. In sudden rallies, traders may enter late and face poor risk-reward. In volatile markets, repeated false signals can damage confidence and capital.
Financial astrology attempts to solve part of this problem by studying timing before the chart confirms the move. For example, if a trader knows that a high-volatility planetary window is approaching, they may reduce leverage, tighten risk, avoid emotional entries, or wait for cleaner confirmation. They do not need to predict the exact move. They simply become aware that the market environment may become unstable.
This is especially useful for swing traders, position traders, and investors who care about timing but do not want to react to every small candle. Astrology can help them identify when patience is better than action and when a quiet market may be preparing for a larger move.
Why Astrology Needs Chart Confirmation
Although astrology can provide timing insight, it should not be used without chart confirmation. Markets are complex. Prices move because of earnings, liquidity, interest rates, inflation, policy, geopolitics, institutional flows, options positioning, and investor psychology. Planetary cycles may reflect timing pressure, but they do not remove the need for price evidence.
A difficult Saturn transit may suggest caution, but if the market remains in a strong uptrend with healthy breadth and rising volume, shorting too early can be costly. A Jupiter cycle may suggest optimism, but if price remains below resistance and momentum is weak, buying aggressively may be premature. Astrology identifies a possible window. Charts show whether the market has actually responded.
This is why a practical trader should use astrology as a timing filter, not as a blind signal. If astrology suggests a reversal window, the trader can watch for technical signs such as failed breakouts, bearish divergence, trendline breaks, volume spikes, or rejection candles. If astrology suggests a bullish expansion window, the trader can watch for support holds, accumulation patterns, moving average recovery, or breakout confirmation.
This combination keeps the trader grounded. Astrology helps with anticipation. Technical analysis helps with execution. Risk management protects the account when the forecast is wrong.
Explore Rajeev Prakash Investor Tools
Choose the right financial astrology product for market timing, research, live signals, and daily investor guidance.
Annual Letter 2026
Read the yearly market timing roadmap based on financial astrology, planetary cycles, equities, precious metals, and key investment risk windows.
Explore Annual Letter
Live Signals
Get live trading and investment timing guidance using planetary cycles, technical levels, real-time price movement, and risk windows.
View Live Signals
Daily Newsletter
Start your trading day with daily market bias, financial astrology insights, risk alerts, planetary timing zones, and important levels to watch.
Subscribe Now
Financial Astrology Terminal
Use the Financial Astrology Terminal to track global assets, market cycles, planetary timing windows, watchlists, and financial astrology signals.
Open TerminalHow Financial Astrology Reads Market Sentiment
Financial astrology is deeply connected with market sentiment. Every market cycle includes emotional phases. At the bottom, investors feel fear, doubt, and exhaustion. During recovery, they feel cautious optimism. During expansion, they feel confidence. Near the top, they may feel euphoria. During decline, fear returns. These emotional cycles often repeat.
The Moon is especially important for short-term sentiment because it moves quickly and reflects emotional shifts. New Moons may mark new beginnings or changes in market tone. Full Moons may bring emotional peaks, reversals, or heightened awareness. Eclipses can increase uncertainty and create turning points, especially when they align with important market-sensitive planetary positions.
Mercury cycles can affect communication, data interpretation, trading decisions, and technology-driven markets. Mercury retrograde periods are often associated with confusion, revisions, delays, and miscommunication. In market terms, this may show up as false breakouts, sudden reversals, earnings confusion, data surprises, or unstable narratives.
Mars can increase volatility and aggressive speculation. When Mars forms tense aspects, markets may react quickly to conflict, inflation fears, policy surprises, or risk-off sentiment. Jupiter can bring optimism and liquidity-driven expansion. Saturn can bring reality checks, tighter financial conditions, and defensive behavior. Uranus can create sudden shocks, especially in technology, crypto, and innovation-led assets.
By reading these cycles, financial astrology tries to understand when market psychology may shift. This does not replace economic analysis. Instead, it gives traders another way to study the timing of collective behavior.
How Technical Analysis Reads Market Sentiment
Technical analysis also reads sentiment, but it does so through price and volume. If buyers are aggressive, price breaks resistance. If sellers are stronger, price fails at resistance. If investors are uncertain, price moves sideways. If fear rises, volatility expands. If confidence returns, momentum improves.
Indicators help measure these changes. RSI can show whether buying pressure has become stretched. MACD can show whether momentum is rising or fading. Volume can show whether institutions may be participating. Market breadth can show whether a rally is broad or narrow. Support and resistance show where traders have previously reacted.
The strength of technical analysis is that it is visible. Traders can see exactly where price is trading. They can define a stop loss. They can calculate risk-reward. They can backtest strategies. This makes chart-based signals practical and disciplined.
The weakness is that charts can become crowded. Since many traders watch the same levels, markets often create traps. A stock may break above resistance to attract buyers, then reverse. An index may break support, trigger stop losses, and then recover. Technical signals need context, patience, and risk control.
Financial astrology can help traders avoid reacting blindly to every chart pattern. If a breakout happens during a confusing Mercury retrograde window or near a major eclipse, a trader may wait for stronger confirmation. If a support level holds during a favorable Jupiter or Venus cycle, the trader may have more confidence in the setup.
Combining Astrology and Technical Signals for Better Decisions
The most powerful use of market timing with astrology is to combine it with chart-based trading signals. A trader can begin with the astrological calendar and mark important dates. These may include retrograde stations, eclipses, major planetary aspects, lunar phases, Mars-Saturn periods, Jupiter-Saturn cycles, Uranus shocks, and other market-sensitive alignments. These dates create a timing map.
After creating the timing map, the trader studies charts. They look for assets approaching support, resistance, trendlines, moving averages, or key Fibonacci zones. They check whether momentum is strong or weak. They study volume, volatility, and sector behavior. They ask whether price is confirming the astrological timing window.
For example, if astrology suggests a possible risk window and the S&P 500 is already showing bearish divergence near resistance, the trader may reduce exposure or wait for a breakdown. If astrology suggests an expansion window and a stock is forming a base near support, the trader may wait for a breakout with volume. If astrology suggests confusion and the chart is choppy, the trader may avoid unnecessary trades.
This approach creates a disciplined process. The trader does not buy or sell only because of astrology. The trader does not follow every chart signal blindly. Instead, they look for alignment between time, price, sentiment, and risk.
The Role of Risk Management
No timing method is perfect. Astrology can be wrong. Technical signals can fail. News can override both. A central bank decision, geopolitical event, earnings surprise, regulatory action, or liquidity shock can change market direction quickly. This is why risk management matters more than any single prediction.
Good traders define their risk before entering a trade. They know where the trade idea becomes invalid. They avoid excessive leverage. They size positions according to volatility. They accept that losses are part of the process. They do not turn a timing window into a guaranteed outcome.
Financial astrology should be used to improve preparation, not to create overconfidence. A planetary window may suggest higher risk, but the trader must still wait for price confirmation. A bullish period may suggest opportunity, but the trader must still protect capital if price fails. A strong forecast becomes useful only when it is paired with discipline.
Chart-based trading also needs risk management. A breakout is not a promise. A support bounce is not a guarantee. An indicator signal is not certainty. Traders who treat signals as probabilities usually survive longer than traders who treat them as predictions.
Astrology for Investors vs Traders
Market timing with astrology can serve both investors and traders, but the use case differs. A short-term trader may use lunar cycles, Mercury retrograde periods, Mars aspects, and daily transits to identify volatility windows. A swing trader may use weekly planetary patterns to time entries and exits. A long-term investor may focus on Jupiter-Saturn cycles, Saturn transits, eclipses, and outer planet alignments to understand broader market phases.
Chart-based trading also differs by time frame. Day traders may use intraday patterns, VWAP, momentum indicators, and short-term support and resistance. Swing traders may use daily charts, moving averages, and sector rotation. Investors may use weekly and monthly charts to identify long-term trends.
When both methods are combined, the time frame must match. A long-term astrological cycle should not be used for a five-minute trade. A short-term lunar signal should not decide a long-term investment alone. The trader should align the astrology cycle, chart time frame, and investment objective.
For example, an investor holding a stock for two years may use astrology to identify major accumulation or caution periods, while using weekly charts for confirmation. A swing trader holding for two weeks may use planetary timing windows and daily chart signals. A day trader may only use astrology as a broad volatility warning, not as an exact intraday signal.
Practical Example of an Integrated Approach
Imagine a trader is watching a major technology stock. The stock has rallied strongly and is now near a key resistance level. RSI shows bearish divergence, which means price is making higher highs but momentum is weakening. Volume is also declining on the latest rally. From a chart-based perspective, the stock may be losing strength.
At the same time, the astrological calendar shows a Mercury retrograde station and a tense Mars-Uranus aspect in the same week. Mercury may bring confusion, data revisions, or communication issues. Mars-Uranus may bring sudden shocks, volatility, or unexpected price movement. This does not guarantee a decline, but it suggests that the timing may be sensitive.
A disciplined trader does not short immediately. Instead, the trader waits. If the stock fails at resistance, forms a reversal candle, and breaks short-term support, the trader may consider a bearish trade with a defined stop. If price breaks above resistance with strong volume, the trader avoids fighting the trend. In this way, astrology creates awareness, while the chart creates the trade trigger.
Now imagine the opposite situation. A stock has corrected sharply and is approaching long-term support. Sentiment is negative. RSI is oversold. Price begins forming a base. The astrological calendar shows a supportive Jupiter aspect and a favorable New Moon period. The trader watches for accumulation. If price breaks above a short-term resistance with volume, the trader may take a long position. Again, the decision comes from alignment, not blind belief.
Why Institutional Investors May Find Timing Layers Useful
Family offices, hedge funds, wealth managers, and institutional investors often use many layers of analysis. They study fundamentals, macroeconomics, quantitative models, sentiment data, volatility, positioning, liquidity, and technical charts. Financial astrology can be positioned as an additional timing layer rather than a replacement for established methods.
Institutions rarely need vague predictions. They need risk windows, probability maps, scenario planning, and timing intelligence. Astrology can help create a calendar of periods where caution, volatility, reversal, or acceleration may be more likely. This can support portfolio hedging, exposure adjustment, sector rotation, and tactical allocation.
For example, a fund may not use astrology to decide whether a company is fundamentally strong. That still requires earnings analysis, valuation, management quality, balance sheet strength, and industry trends. However, astrology may help decide whether the timing is favorable for entry, whether volatility may rise around a certain date, or whether a portfolio should reduce aggressive exposure before a stressful planetary window.
This is where financial astrology becomes more practical. It does not need to compete with modern finance. It can work as a market timing overlay. When used carefully, it may help investors prepare for uncertain periods instead of reacting after volatility has already appeared.
Common Mistakes Traders Make with Astrology and Charts
Many traders make the mistake of using astrology as a shortcut. They see one planetary transit and assume the market must move in a certain direction. This creates overconfidence. Astrology works best when it studies multiple factors, historical context, asset sensitivity, and chart confirmation.
Another mistake is ignoring price. If the chart does not confirm the astrological view, the trader should wait. Markets can remain irrational longer than expected. A bearish timing window may produce only a small correction. A bullish cycle may produce sideways movement instead of a rally. Price action must guide execution.
Technical traders make a different mistake. They often depend too heavily on indicators without understanding broader timing. They may buy every breakout or sell every breakdown without considering volatility windows, sentiment shifts, or macro events. This leads to false signals.
A balanced trader avoids both extremes. They respect astrology but demand confirmation. They respect charts but understand that price patterns can fail. They stay flexible, manage risk, and think in probabilities.
The Future of Market Timing
Modern markets are becoming faster, more data-driven, and more emotional at the same time. Algorithms react to headlines in seconds. Retail traders move through social media narratives. Crypto markets trade nonstop. Central banks influence liquidity. Options flows can increase volatility. In this environment, timing has become more important than ever.
Chart-based trading will remain essential because price is the final truth of the market. However, many traders are also looking for alternative timing tools that help them prepare before price confirms the move. Financial astrology can fill that role for those who study it seriously and use it responsibly.
The future may not belong to one method alone. It may belong to integrated systems. A trader may use fundamental analysis to select quality assets, technical analysis to define price levels, financial astrology to identify timing windows, and risk management to protect capital. This layered approach is more realistic than depending on one signal.
Market timing with astrology becomes valuable when it adds context, discipline, and preparation. Chart-based trading signals become more powerful when they are filtered through timing awareness. Together, they can help traders avoid emotional decisions and focus on high-quality setups.
Conclusion: Time, Price, and Discipline Must Work Together
Market timing with astrology and chart-based trading signals are not enemies. They answer different questions. Astrology asks when the market may become sensitive. Charts ask whether price has confirmed the move. Astrology studies time cycles and collective psychology. Technical analysis studies price, volume, trend, and momentum.
A trader who uses only astrology may enter too early or ignore price evidence. A trader who uses only chart signals may react late or fall into common technical traps. But a trader who combines both can build a more complete market timing process.
The best approach is simple. Use astrology to identify important timing windows. Use charts to confirm direction and entry levels. Use risk management to protect capital. Use patience to avoid forcing trades. In financial markets, no method can remove uncertainty. However, a disciplined blend of time analysis and price confirmation can help traders make better decisions.