Intraday Turning Points In U.S. Index Futures
Intraday trading in U.S. index futures often looks chaotic on the surface, especially if you focus only on the last few ticks in the order book. Yet beneath the noise, price tends to react around certain time windows and structural levels with surprising regularity. These are the intraday reversal zones that shape the trading day in contracts like the E-mini S&P 500 (ES), E-mini Nasdaq 100 (NQ), and their micro counterparts. When you understand where and when these zones tend to form, you move from guessing short term swings to working with a structured edge.
The idea of this page is to treat intraday reversal trading as a systematic process rather than a series of heroic calls. Instead of relying on instinct alone, you combine market structure, time of day patterns, volatility regimes and pattern recognition into a framework. This is where the Intraday Reversal Zones toolkit comes in, built around four concepts. The Time-of-Day Edge Map highlights which parts of the session historically carry the strongest reversal tendencies. The Volatility Windows Detector identifies when the volatility backdrop is supportive of meaningful reversals rather than noisy chop. The Reversal Probability Gauge compresses multiple inputs into a simple confidence reading. The ES/NQ Pattern Replay allows you to learn from historical intraday plays in a concrete, visual way.
When you bring these elements together, you begin each session with a clear sense of where reversals are more likely, what kind of volatility environment you are trading in and how aggressive or conservative your tactics should be. Instead of chasing every spike, you wait for the market to come into alignment with your reversal zone criteria. This is how professional traders turn intraday swings from random opportunity into a repeatable playbook.
Why Intraday Reversals Matter More Than Directional Bias
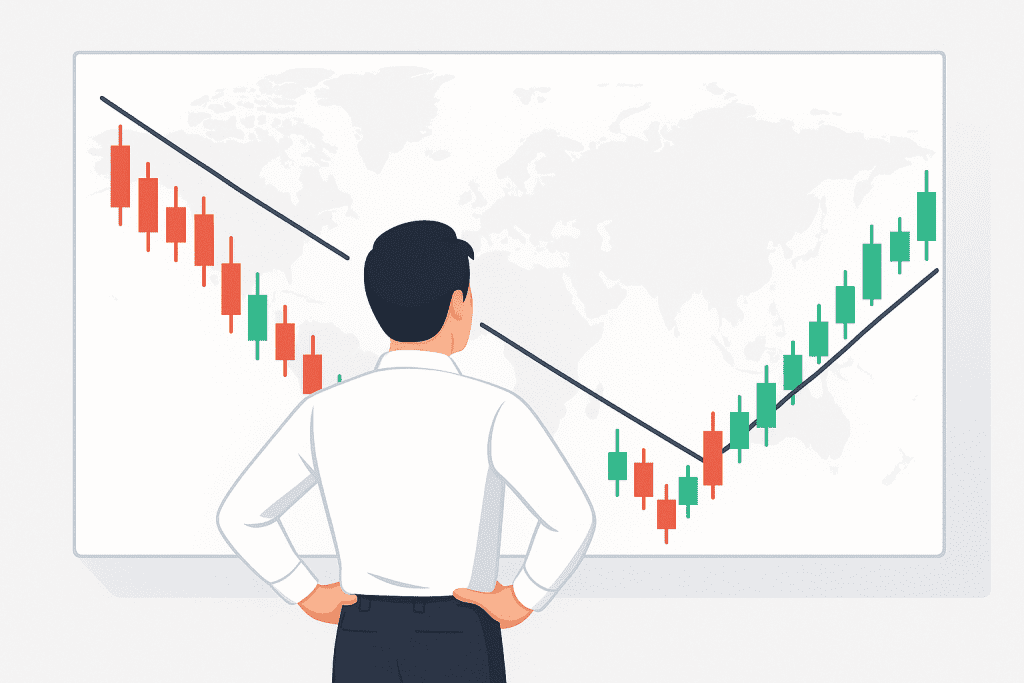
Many traders obsess over whether the index will close green or red on the day. For intraday futures traders, that question is less important than understanding how the path of price will unfold between the open and the close. The most profitable opportunities often arise not from correctly guessing the daily direction, but from catching the swings that occur inside the day when the market overshoots and snaps back.
Intraday reversals are powerful because they reflect the tug-of-war between different participant groups. Early in the session, overnight positions and gap traders dominate. As the day progresses, institutional flows, hedging programs, systematic intraday models and options hedging flows all interact with each other. When one side overextends, the other side finds an attractive risk reward point to push against that move, creating a reversal zone. These zones are not random; they cluster around certain times, structural reference levels, and volatility setups.
If you are long in a strong morning trend and the market approaches a typical reversal window with stretched intraday ranges and extreme momentum readings, your goal is not to prove that you can hold to the very top. It is to recognise that the game is shifting from trend continuation to mean reversion and adjust your risk accordingly. That might mean taking partial profits, tightening stops or even exploring a reversal trade back toward the day’s balance. The Intraday Reversal Zones framework helps you make those decisions without relying purely on gut feeling.
Understanding Intraday Structure In ES And NQ
Before you can identify intraday reversal zones, you need a mental map of how an average U.S. index futures session is structured. The regular trading hours session for ES and NQ runs from the New York open through to the cash close, but the futures trade nearly around the clock. Overnight price action sets the opening conditions in terms of gaps, overnight ranges and reference levels such as the overnight high and low.
The first part of the regular session is dominated by price discovery. Liquidity is heavy, spreads are tight and order flow can be highly directional as overnight imbalances are unwound and cash equity flows start to impact futures. This opening drive period often sets the initial range of the day, from which many subsequent reversals will anchor. If the opening drive pushes aggressively in one direction and stalls near a key higher time frame level or a prior day extreme, that region is a candidate for an early reversal zone.
Once the early drive has played out, the market often develops an initial balance range, roughly representing the first hour of trade. Many intraday models pay attention to this range, because breaks above or below it later in the day often carry information about whether the day will remain balanced or trend. Rejections from the edges of this range, especially during known reversal time windows, form classic intraday reversal setups. Later in the session, as liquidity changes and options hedging flows evolve, new reversal zones emerge near the prior day high and low, key volume nodes and round number reference points.
The goal of the Intraday Reversal Zones toolkit is to put this structural understanding into a practical, repeatable workflow. The Time-of-Day Edge Map, Volatility Windows Detector, Reversal Probability Gauge and ES/NQ Pattern Replay each address parts of this structure so you can see where the day’s path is most likely to bend.
Time-of-Day Edge Map: Why Certain Minutes Matter More
Not all minutes of the trading day are created equal. The Time-of-Day Edge Map focuses on this reality by highlighting which intraday windows have historically shown a higher tendency for reversals in ES and NQ. It looks at statistical tendencies around the open, the period after major economic releases, the middle-of-the-day lull and the approach to the cash close. By mapping these tendencies, the tool gives you a temporal scaffold to hang your intraday expectations on.
Consider the first reversal window that typically appears after the opening drive. Markets that open with a strong gap and drive in one direction frequently pause, exhaust or retrace after that initial burst of activity. The Time-of-Day Edge Map captures the average behaviour around this early period. If the market has opened with a dramatic trend and reaches a structural level during this window, your awareness of the reversal tendency helps you avoid chasing the last part of the move and instead prepare for a possible fade or at least a consolidation.
Later in the day, after lunch, another common reversal window emerges. Many traders recognise that midday sessions can be quieter, with lower participation and thinner order flow. At the same time, as the market transitions from that lull into the final hours of trading, fresh flows come in from institutional rebalancing and options hedging adjustments. This can create a second reversal zone where trends fail or oversold conditions bounce. The Time-of-Day Edge Map does not treat these windows as guaranteed turning points, but as context that should shape how aggressively you press in the direction of an existing move versus how alert you are for mean reversion opportunities.
Once you have internalised this time framework, you no longer treat each tick as equally meaningful. Instead, you read intraday price action through the lens of when you are in the day’s cycle, looking for alignment between price extension, structural reference levels and time-of-day tendencies. That alignment is where the highest quality reversal zones tend to form.
Long Term Skill Development With ES And NQ Reversal Zones
Finally, it is worth recognising that mastery of intraday reversal trading is a long term craft. The Intraday Reversal Zones toolkit shortens your learning curve by giving you a structured way to analyse sessions, but it does not eliminate the need for practice and reflection. Consistently using ES/NQ Pattern Replay to review your best and worst reversal trades, annotating charts with notes on time of day, volatility regime and Gauge readings, and periodically updating your playbook as you gather more data are all part of turning this framework into lived skill.
Over months and years, you will begin to see recurring motifs. Certain types of days will become instantly recognisable in their early stages, and you will know from experience whether they are likely to reward reversal tactics or punish them. You will develop an intuitive feel for when a move has extended far enough in the context of current volatility and when a trend still has fuel. You will become less reactive to individual losing trades because you have seen similar situations play out successfully many times before.
Volatility Windows Detector: Linking Range To Reversal Potential
Intraday reversals do not occur in a vacuum. They are strongly influenced by the underlying volatility environment. A session with very narrow ranges and compressed intraday volatility offers fewer meaningful reversal opportunities, because price rarely moves far enough away from value to create an attractive mean reversion setup. By contrast, a session with explosive volatility can produce large swings, but also carry elevated risk of deep adverse excursions if you fade too early.
The Volatility Windows Detector is designed to quantify this backdrop. It tracks measures like average true range on intraday bars, realised volatility over rolling windows and the expansion or compression of intraday ranges compared to recent history. Its goal is to classify the current session into volatility regimes such as compressed, normal or expanded, and to highlight windows when volatility is either breaking out from a low baseline or starting to compress after an intense phase.
When volatility breaks out from a previously quiet state, early reversal attempts can be dangerous. The first leg of the move is often the most powerful as positioning and options hedging adjust to the new reality. The Volatility Windows Detector helps you see that you are in a new volatility regime, where trying to fade the first sharp impulse without structural confluence is a low quality proposition. On the other hand, when volatility has already been elevated and the Detector shows signs of intraday exhaustion, such as repeated large wicks into extremes that fail to extend the move, it may be signalling that the market is ripe for a reversal back toward balance.
This volatility context also guides your risk management. In expanded volatility windows, you might scale down your position size, widen stops slightly and demand stronger confluence before taking a reversal setup. In compressed environments, you might accept tighter targets, quicker profit taking and less ambitious reversal expectations. The Volatility Windows Detector makes these adjustments explicit instead of leaving them to vague intuition.
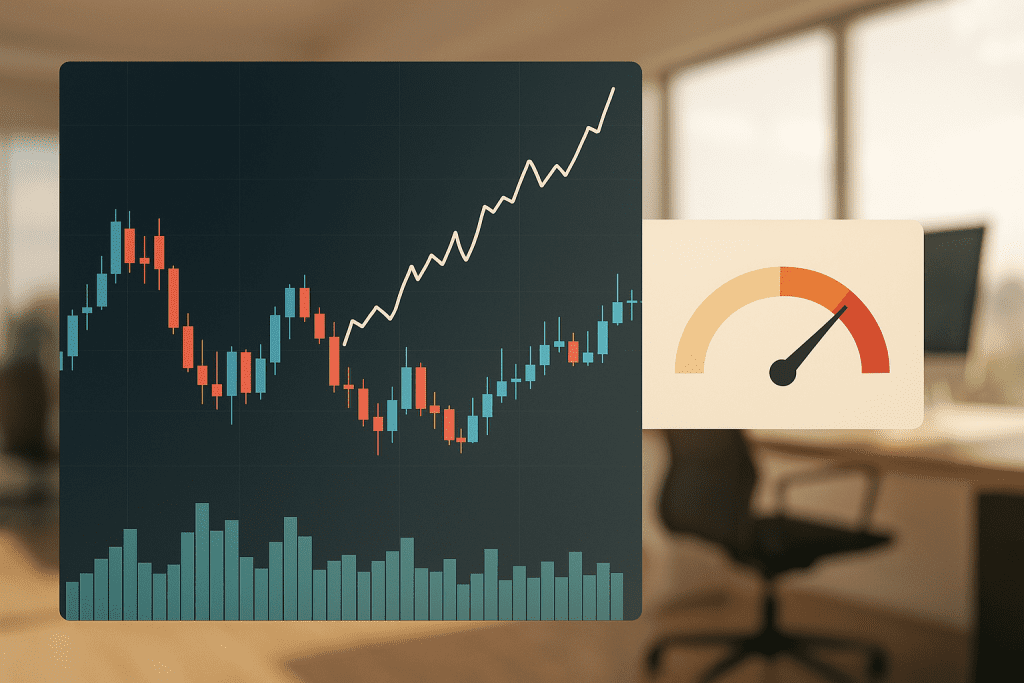
Reversal Probability Gauge: Turning Complex Context Into A Single Reading
Human attention is limited. During a fast moving intraday session, it is easy to become overwhelmed by multiple data points and lose the thread of what matters. The Reversal Probability Gauge exists to simplify this complexity by aggregating several key factors into a single, intuitive reading. It does not claim to be an oracle of market turns, but it does act as a helpful synthesis of context that you can glance at in real time.
The Gauge might incorporate ingredients like time-of-day positioning from the Edge Map, volatility regime classification from the Volatility Windows Detector, distance from key intraday and higher time frame levels, recent momentum, and perhaps measures of intraday sentiment such as breadth or volume thrust. Each factor contributes positively or negatively to an internal score. When enough conditions align in favour of a reversal, the Gauge reading climbs, suggesting that fading the current direction may have a favourable probability profile. When those conditions are absent, the Gauge reading remains low, nudging you to respect the prevailing trend.
For example, imagine that ES has rallied strongly from the open into the first reversal window, reaching the prior day high and stalling. The Time-of-Day Edge Map flags a typical reversal zone, the Volatility Windows Detector shows an expanded intraday range relative to recent days and momentum indicators are extended. Under such a configuration, the Reversal Probability Gauge might climb into a high confidence band, signalling that this is not an ideal moment to chase longs and that a carefully managed short reversal attempt has merit.
On another day, suppose the market grinds higher in a steady, low volatility climb without hitting any major reference levels, and the move occurs outside of known reversal windows. In this case, the Gauge stays low despite the trend being mature in terms of time simply because the necessary ingredients for a quality reversal zone have not yet assembled. The value of the Gauge lies in this ability to say not just that the market has moved a lot, but that the context either supports or does not support a mean reversion attempt.
Intraday Reversal Tools
Time-of-day edges, volatility regimes, reversal probability and ES/NQ pattern replay.
Time-of-Day Edge Map
Reversal tendency by session window.
Volatility Windows Detector
Intraday volatility regime simulation.
Normal
Reversal Probability Gauge
Odds of intraday reversal.
0%
Odds
ES/NQ Pattern Replay
Random historical template.
ES/NQ Pattern Replay: Learning From Historical Price Paths
No matter how sophisticated your real time tools are, your instincts are ultimately shaped by what you have already seen. The ES/NQ Pattern Replay component of the Intraday Reversal Zones framework is designed to accelerate that experiential learning. It allows you to step through historical sessions for ES and NQ, focused specifically on how intraday reversals formed and resolved. Instead of vaguely remembering that some days reversed near the open or near the close, you see the full sequence of events play out bar by bar.
When you replay a session, you can observe how price interacts with overnight levels, initial balance highs and lows, prior day extremes and higher time frame support and resistance zones. You can see where the Time-of-Day Edge Map would have flagged a potential reversal window, how the Volatility Windows Detector would have classified the volatility regime at each stage, and what the Reversal Probability Gauge might have shown as conditions evolved. This contextual overlay turns replay from a simple chart exercise into a living simulation of your full framework.
Over time, patterns emerge. You will notice that some reversal zones tend to fail repeatedly in certain environments, such as fading strong trend days with persistent sentiment and news catalysts. You will see that other reversal setups, like rejections of overnight extremes during the transition from the open to the early session balance, tend to behave more reliably. The more you expose yourself to these historical examples, the more refined your sense of which real time reversal zones deserve your capital and which should be observed from the sidelines.
ES/NQ Pattern Replay also builds confidence. When you have seen dozens of instances where a particular combination of time, volatility, structure and sentiment produced a clean reversal, you are more likely to act decisively the next time a similar configuration appears live. That confidence is not wishful thinking; it is grounded in the statistical and visual evidence you have accumulated through deliberate practice.
Live Signals: Turning Intraday Reversal Zones Into Real Trades
Live signals bridge the gap between theory and execution for traders who follow intraday reversal zones in U.S. index futures. The framework of Time-of-Day Edge Map, Volatility Windows Detector, Reversal Probability Gauge and ES/NQ Pattern Replay gives you the structure, but in the heat of the session it can still be difficult to act decisively.
Designing A Daily Intraday Reversal Playbook
With the Time-of-Day Edge Map, Volatility Windows Detector, Reversal Probability Gauge and ES/NQ Pattern Replay as your core tools, you can build a daily playbook for intraday reversal trading in U.S. index futures. The playbook is not a rigid script; it is a structured checklist that defines how you will interpret conditions before the open, during key time windows and into the close.
Before the regular session begins, you review overnight action and higher time frame levels. You identify where the overnight high and low sit relative to the prior day range, weekly levels and key moving averages. The Time-of-Day Edge Map helps you mark where in the early session you will be especially alert for reactions around these levels. You also run your Volatility Windows Detector on recent sessions to see whether intraday ranges have been expanding or compressing, which shapes your risk expectations for the upcoming day.
As the session unfolds, you track how price behaves relative to the opening print, initial balance range and prior reference points. When the market approaches these levels near known reversal windows, you glance at your Reversal Probability Gauge. If the Gauge is low because volatility is compressed and other conditions are absent, you allow the test through the level to play out without forcing a reversal attempt. If the Gauge is high and the price action confirms exhaustion, such as large tails, failed breaks or sharp rejection, you consider putting on a reversal trade with defined risk.
At the end of the day or during quieter periods, you use the ES/NQ Pattern Replay to study sessions that behaved in similar ways. You may review days with strong morning reversals, failed afternoon fades or trend days that ignored typical reversal windows. Each review refines your playbook, leading you to adjust how much weight you give to time-of-day signals versus volatility cues, or to reclassify certain patterns as higher or lower quality. The playbook becomes a living document anchored by these four tools, guiding your behaviour without stifling your judgment.
Why Choose Us ?
Astrodunia guides you through the market’s ups and downs with the help of planetary science. Our team of experts in financial astrology provide valuable insights and predictions to assist you in market wise investment decisions and navigate the global market with ease.
Market Forecasting
Experience the advantage of enhanced market predictions. Our unique approach combines traditional analysis with astrological insights for more accurate predictions and better investment opportunities.

Decades of Market Timing Expertise
For over 20 years, we’ve honed our skills in market timing within the stock market. Our extensive experience allows us to navigate market trends with precision and confidence.

Trusted by Discerning Investors
Our clients choose us for our proven track record of success and our commitment to providing them with the most reliable market insights. Join the ranks of satisfied investors who trust our expertise
Risk Management Around Reversal Attempts
Reversal trading carries its own set of risks. By definition, you are trading against the immediate direction of price, even if you believe the move is stretched. This makes risk management central to the Intraday Reversal Zones approach. The framework is not about calling tops and bottoms with bravado, but about identifying regions where the risk reward ratio of a carefully defined reversal setup is acceptable relative to your overall trading plan.
Position sizing should reflect both the volatility regime flagged by the Volatility Windows Detector and the strength of the confluence behind the reversal zone. In high volatility sessions, you might choose smaller size with slightly wider stops, focusing on only the highest confidence setups as indicated by the Reversal Probability Gauge. In quieter sessions, you might scale slightly larger in notional terms, given that intraday swings are smaller and reversals tend to be more contained. In all cases, your risk per trade and your daily loss limits should be consistent with your broader risk capacity rather than improvised on the fly.
Stop placement is ideally anchored to structural features that invalidate your reversal thesis rather than arbitrary tick distances. For example, if you are fading a move into a prior day high during a known reversal window, your stop might sit just beyond the structural level plus a small buffer, signalling that if price can break and hold above that area, your belief in an imminent reversal is likely wrong. As the trade develops, you can trail stops or scale out based on how decisively the market moves back toward intraday value or the midpoint of the day’s range.
The Intraday Reversal Zones framework also encourages you to accept that not every candidate zone must be traded. Sometimes the Reversal Probability Gauge will be elevated, but you may have already reached your risk limit for the day. Sometimes the pattern looks compelling, but actual execution liquidity is thin or slippage risk is high. Declining to participate in such situations is itself an expression of professional risk management. The goal is not to catch every reversal the market offers, but to participate in enough high quality setups, managed with discipline, that your edge plays out over time.
Psychology Of Waiting For High Quality Reversal Zones
One of the least discussed but most important aspects of intraday reversal trading is psychological patience. Markets offer constant movement, and it is tempting to treat every minor intraday pause as the start of a major reversal. The Intraday Reversal Zones framework is designed not only to point you toward good opportunities but also to help you stay out of low quality ones. Tools like the Time-of-Day Edge Map and Reversal Probability Gauge act as brakes on impulsive behaviour by reminding you that context matters.
Waiting for price to travel into a confluence zone can feel uncomfortable when you fear missing out on a move. Waiting for the right time window, volatility backdrop and structural setup requires trust in your process. This is where the ES/NQ Pattern Replay becomes a psychological anchor. Repeatedly seeing how disciplined patience would have been rewarded in historical sessions builds confidence that the same discipline will pay off in future ones. You teach your mind that it does not need to chase; high quality zones reoccur, and you only need a subset of them to achieve attractive results.
The framework also helps you deal with the inevitable losing trades. When you define reversal zones based on clear criteria, a stopped-out trade is simply a data point that the market did not respect your confluence this time, not a personal failure. You can review such trades in the context of your tools, asking whether the Time-of-Day Edge Map, Volatility Windows Detector and Reversal Probability Gauge were truly aligned, or whether you forced a trade in a marginal zone. This turns emotional reactions into learning opportunities and keeps your psychological capital intact.
Meet Our Team
Get to know our dedicated team of experts. With a diverse range of skills and years of experience, we’re committed to providing you with the best market analysis and investment guidance.

Mr. Rajeev Prakash Agarwal
Founder
Expert in financial & personal astrology for 20 years+. Rajeev is a well-known astrologer based in central India who has a deep understanding of both personal and mundane astrology.

Mr. Shashi Prakash Agarwal
Technical Head
Shashi is a technology leader with a strong background in global business.He holds a B. Tech in Computer Science & MBA in Finance from Narsee Monjee Institute of Management Studies, one of the top B-Schools in India.
Conclusion: From Random Fades To Structured Intraday Reversal Campaigns
Intraday reversals in U.S. index futures are not rare accidents; they are recurring features of how markets process information and flows across the trading day. The difference between traders who benefit from them and those who are hurt by them lies in preparation, structure and discipline. The Intraday Reversal Zones framework transforms reversal trading from a set of random fades into a structured campaign built around four core tools.
The Time-of-Day Edge Map reminds you that certain minutes of the session carry more weight than others. The Volatility Windows Detector shows you when the backdrop makes reversals more or less attractive from a risk reward perspective. The Reversal Probability Gauge simplifies complex context into an actionable reading so you can focus on execution. The ES/NQ Pattern Replay helps you internalise these ideas through repeated, realistic practice on historical sessions.
When you integrate these tools with sound risk management and a clear psychological mindset, each session in ES and NQ becomes less of a guessing game and more of a deliberate exploration of where the market is likely to bend or snap back. You learn to welcome volatility instead of fearing it, because you have a framework that tells you when to lean into a reversal zone and when to stand aside. Over time, this structured approach can turn intraday swings from a source of frustration into a consistent and reliable part of your trading edge.
Whether you’re a seasoned investor or just starting out, our financial astrology tools can be tailored to your specific investment goals. Gain valuable insights to achieve your financial aspirations.
Address
1301, 13th Floor, Skye Corporate Park, Near Satya Sai Square, AB Road, Indore 452010
+91 9669919000
© All Rights Reserved by RajeevPrakash.com (Managed by AstroQ AI Private Limited) – 2025