Your cart is currently empty!
How to Spot Market Reversals
Market reversals are critical points in trading where the prevailing trend changes direction, either from bullish to bearish or vice versa. Spotting these reversals accurately can present significant profit opportunities and help traders make timely decisions about entering or exiting positions. Identifying market reversals is an essential skill for traders looking to minimize risk and maximize gains, especially in volatile market environments. This article will discuss key techniques and indicators used to spot market reversals, helping you develop a better understanding of how to navigate changing market trends.
1. Characteristics of Market Reversals
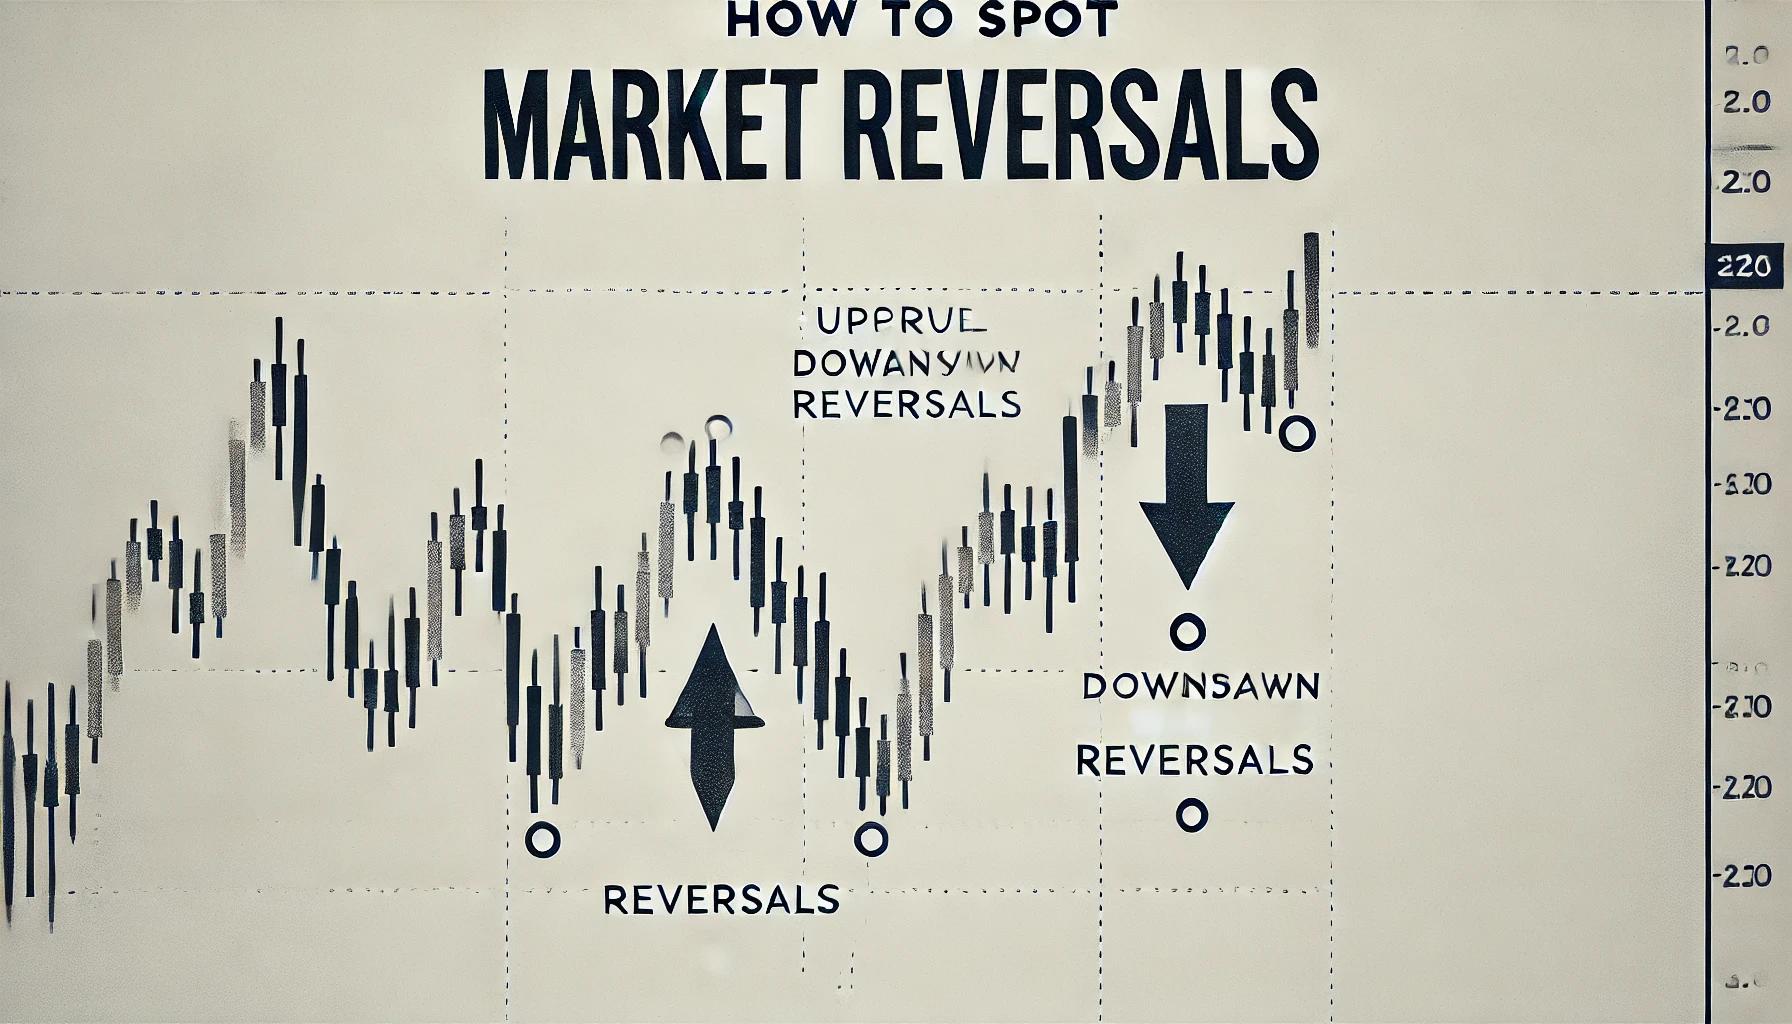
A market reversal occurs when the price of an asset changes direction, breaking away from an established trend. Reversals can happen in both uptrends and downtrends. An uptrend reversal occurs when a previously rising market starts declining, while a downtrend reversal happens when a previously declining market begins to rise.
It’s important to note that market reversals are different from corrections. A correction is a temporary pause or pullback within an ongoing trend, while a reversal indicates a complete change in direction. Understanding this distinction helps traders avoid confusion and make informed decisions about their positions.
2. Key Indicators to Spot Market Reversals
a. Moving Averages
Moving averages are one of the most popular tools for identifying market reversals. Traders use moving averages to smooth out price data and identify changes in trend direction. When a short-term moving average crosses below a long-term moving average, it signals a potential bearish reversal, known as a “death cross.” Conversely, when a short-term moving average crosses above a long-term moving average, it indicates a potential bullish reversal, called a “golden cross.”
b. Relative Strength Index (RSI)
The Relative Strength Index (RSI) is a momentum oscillator that helps traders determine whether an asset is overbought or oversold. An overbought condition (typically an RSI reading above 70) may signal an upcoming bearish reversal, while an oversold condition (typically an RSI reading below 30) may indicate an impending bullish reversal. The divergence between the RSI and price action can also serve as an early warning sign of a potential reversal.
c. Support and Resistance Levels
Support and resistance levels are critical in identifying potential reversals. When the price approaches a significant support or resistance level and fails to break through, it may signal a reversal. For instance, if an asset is in an uptrend but fails to break through a strong resistance level multiple times, it could indicate a weakening trend and an impending bearish reversal.
d. Candlestick Patterns
Candlestick patterns are powerful tools for identifying market reversals. Certain candlestick formations, such as the “hammer,” “shooting star,” “engulfing,” and “doji,” can signal an impending reversal. For example, a hammer pattern, characterized by a small body and a long lower wick, suggests that buyers are stepping in after a downtrend, potentially signaling a bullish reversal.
e. Divergence
Divergence occurs when the price of an asset is moving in the opposite direction of an indicator, such as the RSI or MACD. A bullish divergence occurs when the price makes lower lows while the indicator makes higher lows, suggesting that selling momentum is weakening and a reversal to the upside could occur. Conversely, bearish divergence occurs when the price makes higher highs while the indicator makes lower highs, indicating that buying momentum is fading and a reversal to the downside may be imminent.
3. Market Reversal vs. Trend Continuation
Traders need to distinguish between a market reversal and a trend continuation. A trend continuation occurs when the price experiences a brief pullback or consolidation before resuming its original trend. Traders should use multiple indicators and timeframes to confirm a reversal before taking action.
One way to confirm a market reversal is by looking at the volume. A reversal accompanied by increased trading volume is more likely to be genuine. Additionally, using multiple timeframes can help validate a potential reversal. For instance, if a reversal pattern is identified on both a 1-hour chart and a daily chart, the likelihood of a true reversal increases.
4. Common Mistakes When Identifying Reversals
a. Acting Too Soon: One of the most common mistakes traders make is acting too soon based on incomplete information. It’s important to wait for confirmation before entering a trade based on a potential reversal signal. This could mean waiting for a candlestick pattern to complete or for an indicator to confirm the change in direction.
b. Ignoring the Bigger Picture: Traders often focus too much on short-term price action and overlook the larger trend. Market reversals are more reliable when they align with significant support and resistance levels or when they occur after an extended trend.
c. Overreliance on One Indicator: Relying solely on one indicator to identify a reversal can lead to false signals. It is best to use a combination of indicators, such as moving averages, RSI, and candlestick patterns, to confirm a potential reversal.
5. Tips for Successfully Spotting Reversals
Use Multiple Indicators: Combining different indicators increases the likelihood of accurately identifying a market reversal. Moving averages, RSI, support and resistance levels, and candlestick patterns should all be considered.
Wait for Confirmation: Don’t jump into a trade at the first sign of a reversal. Wait for confirmation signals, such as increased volume or a completed candlestick pattern, to reduce the risk of false breakouts.
Pay Attention to Volume: Volume is a key factor in determining the strength of a reversal. A significant increase in volume during a potential reversal indicates strong market participation and increases the likelihood of a sustained trend change.
6. Conclusion: Mastering Market Reversals
Spotting market reversals is a valuable skill that can help traders capitalize on changes in market direction and maximize profits. By using a combination of indicators, such as moving averages, RSI, support and resistance levels, and candlestick patterns, traders can improve their ability to identify potential reversals accurately. It is also crucial to avoid common mistakes like acting too soon or overrelying on a single indicator.
Remember, no single tool or strategy can guarantee success in identifying market reversals. Successful traders use a combination of technical analysis, patience, and discipline to navigate the complexities of the financial markets. With practice and experience, you can enhance your ability to spot market reversals and make well-informed trading decisions.

Mr. Rajeev Prakash
Rajeev is a well-known astrologer based in central India who has a deep understanding of both personal and mundane astrology. His team has been closely monitoring the movements of various global financial markets, including equities, precious metals, currency pairs, yields, and treasury bonds.
Featured Post
Financial Astrology Terminal
The Financial Astrology Terminal is a web platform that combines real-time U.S. market data (S&P 500, Nasdaq, Dow, Russell, key stocks and commodities like gold and silver) with planetary cycles, giving traders and investors astro-timing signals on top of normal charts and analysis.