Candlestick charts are a popular tool among traders and investors for analyzing price movements in financial markets. Understanding how to read candlesticks can help you make more informed trading decisions, whether you’re a novice or an experienced trader. This article will break down the basics of candlestick reading, including its components, patterns, and how to use them in your trading strategy.
What Are Candlesticks?
Candlesticks are graphical representations of price movements over a specific period, providing information about the open, high, low, and close prices of an asset. Each candlestick consists of a body and two wicks (or shadows) that indicate the price range during that period.
Components of a Candlestick
- Body: The body of the candlestick shows the opening and closing prices for a specific period.
- Bullish Candlestick: When the closing price is higher than the opening price, the body is usually filled or colored (often green or white).
- Bearish Candlestick: When the closing price is lower than the opening price, the body is filled or colored differently (often red or black).
- Wicks (Shadows): The wicks extend from the body and represent the highest and lowest prices during that period.
- Upper Wick: The line above the body indicates the highest price reached.
- Lower Wick: The line below the body shows the lowest price reached.
Understanding the Candlestick Colors
- Green/White Candlestick: Indicates a bullish trend; the price closed higher than it opened.
- Red/Black Candlestick: Indicates a bearish trend; the price closed lower than it opened.
Candlestick Quick Analyzer
Enter Open, High, Low, Close to get instant candle structure (body and wicks). Educational only.
Time Frames
Candlesticks can represent different time frames, including:
- Minute: For intraday trading (1-minute, 5-minute, 15-minute candlesticks).
- Hourly: For short-term trading (1-hour, 4-hour candlesticks).
- Daily: For swing trading or long-term investing (daily candlesticks).
- Weekly/Monthly: For long-term trends and analysis.
Reading Candlestick Patterns
Candlestick patterns can provide valuable insights into market sentiment and potential price reversals or continuations. Here are some common patterns to look out for:
Single Candlestick Patterns
- Doji: A candlestick with a small body, where the open and close prices are nearly the same. It indicates indecision in the market and potential reversal.
- Hammer: A candlestick with a small body at the top and a long lower wick. It often appears at the bottom of a downtrend and suggests a potential reversal to the upside.
- Shooting Star: A candlestick with a small body at the bottom and a long upper wick. It typically appears at the top of an uptrend and indicates a potential reversal to the downside.
Multiple Candlestick Patterns
- Bullish Engulfing: A two-candle pattern where a small bearish candle is followed by a larger bullish candle. It suggests a potential bullish reversal.
- Bearish Engulfing: A two-candle pattern where a small bullish candle is followed by a larger bearish candle. It indicates a potential bearish reversal.
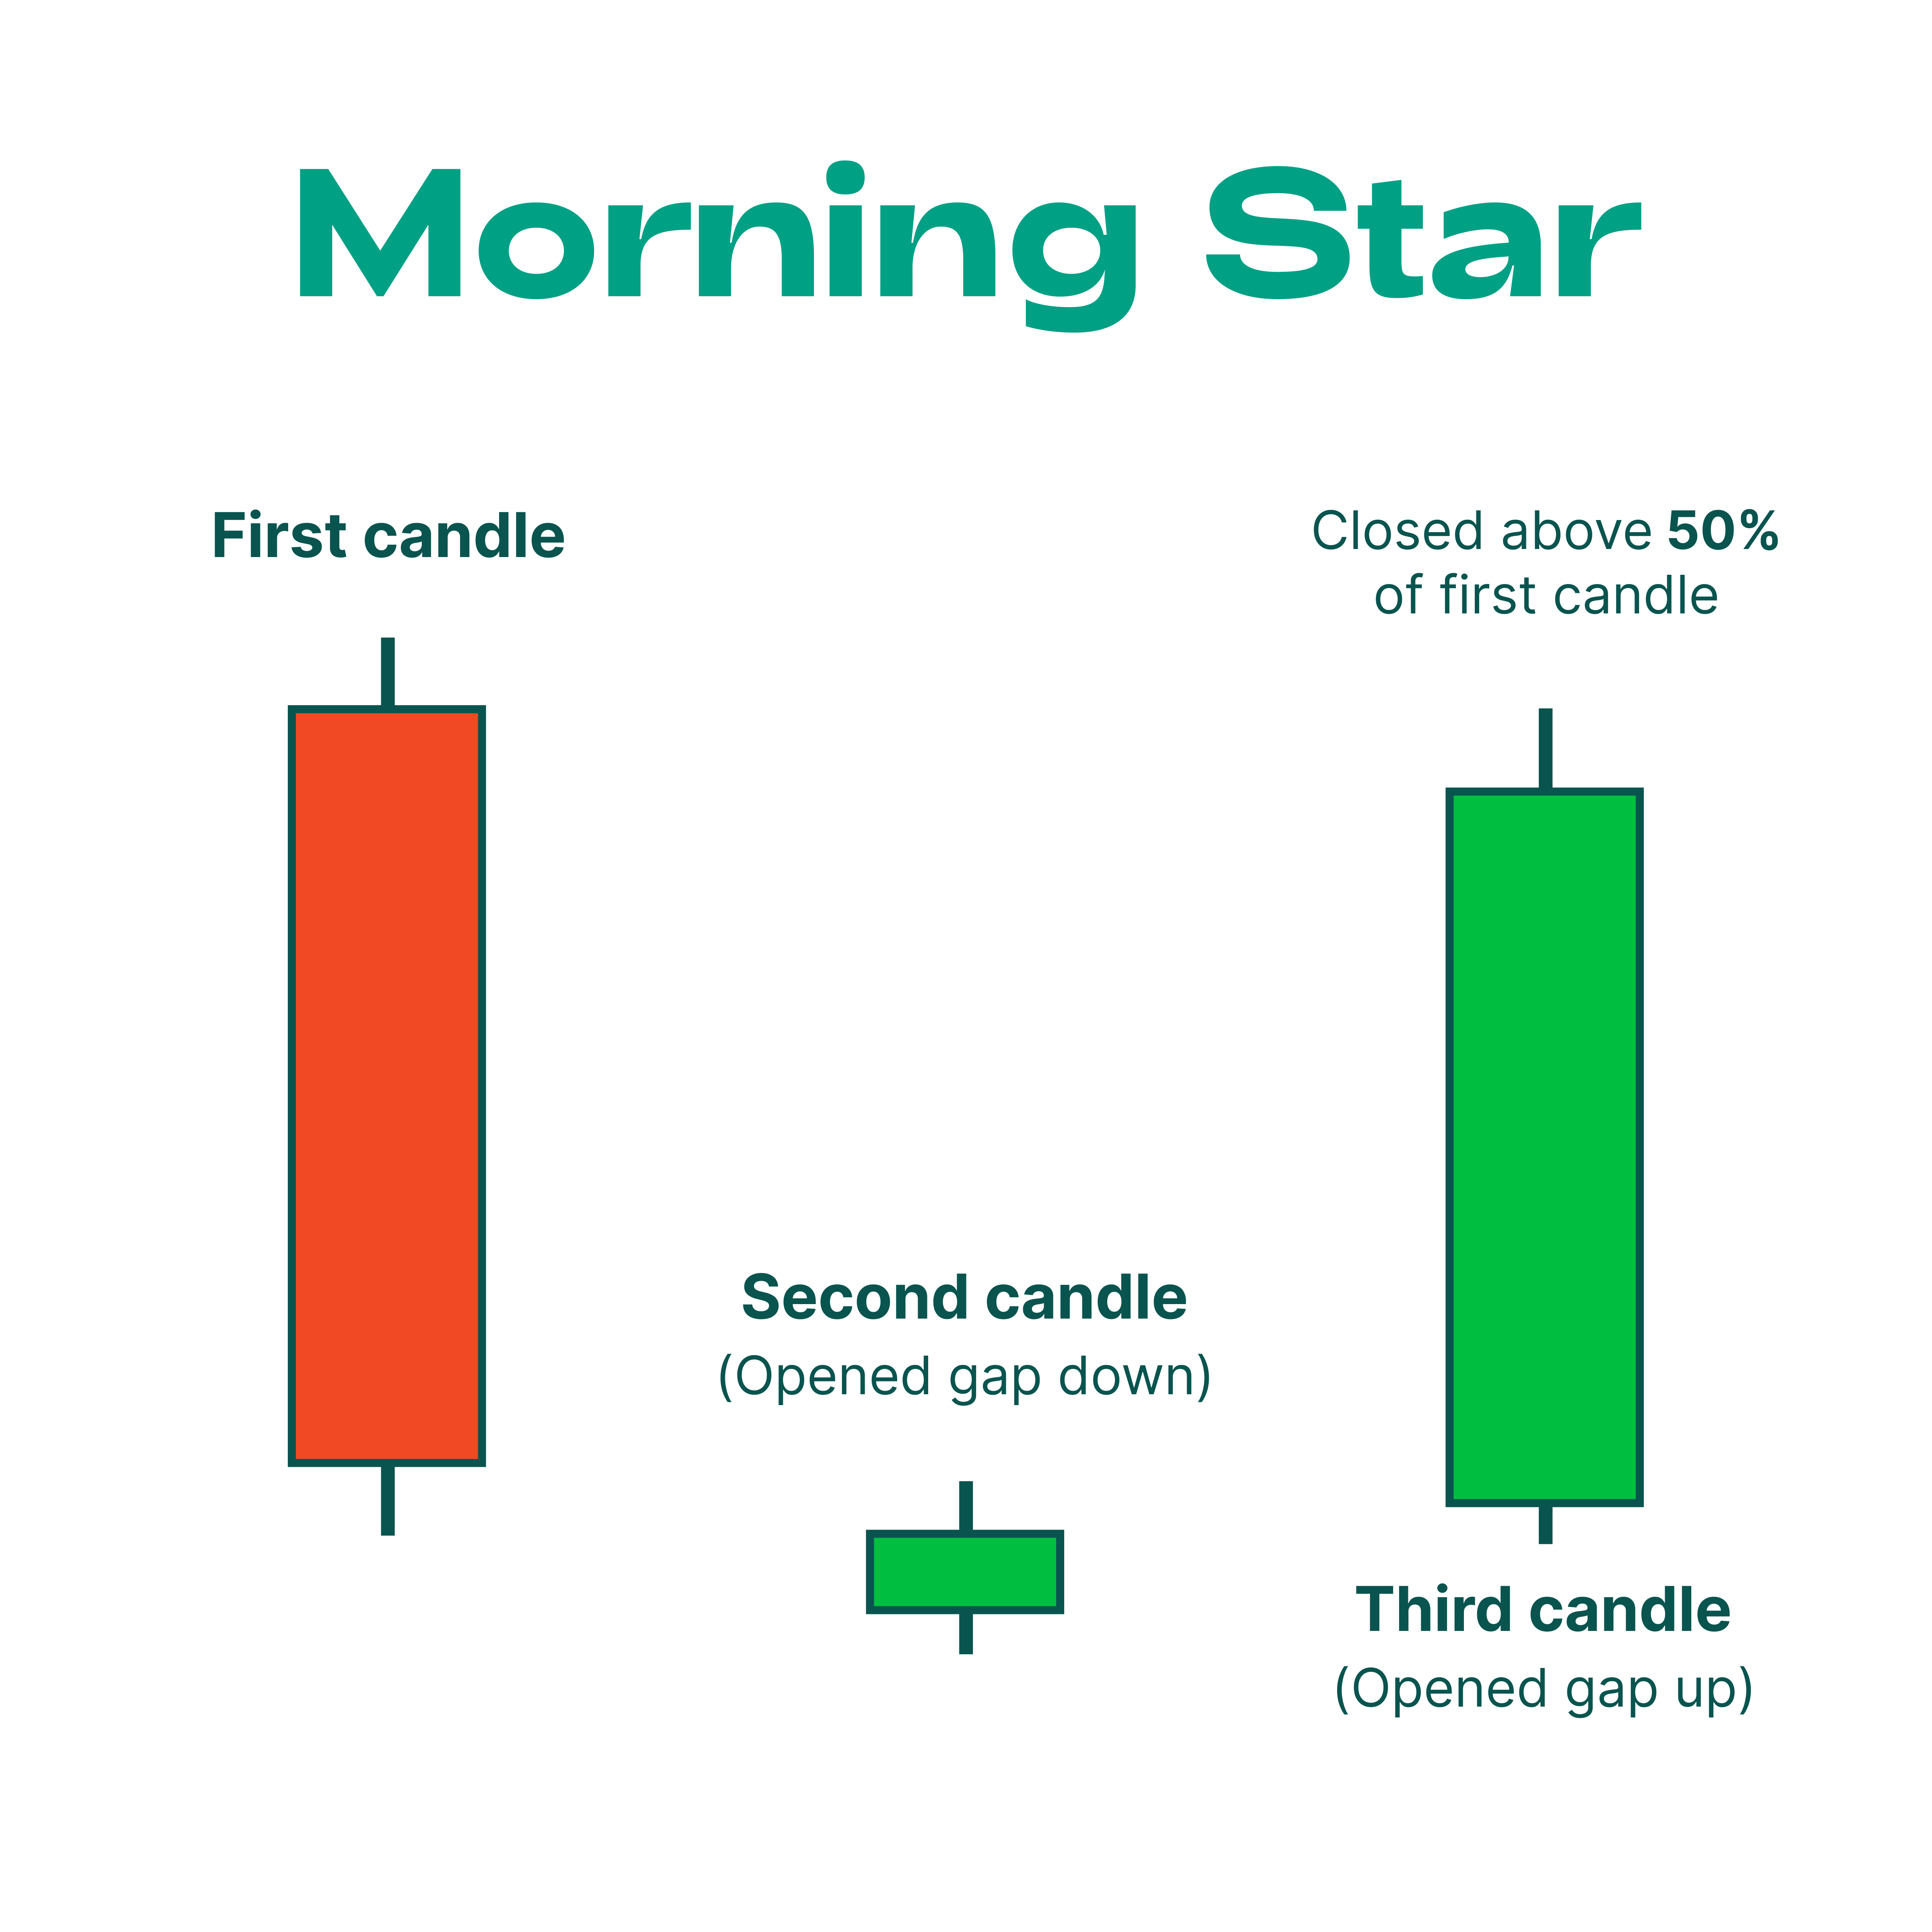
- Morning Star: A three-candle pattern consisting of a bearish candle, followed by a doji or small candle, and then a bullish candle. It signals a potential reversal from bearish to bullish.
- Evening Star: The opposite of the morning star, this pattern features a bullish candle, followed by a doji or small candle, and then a bearish candle, indicating a potential reversal from bullish to bearish.
More Advanced Patterns
- Three White Soldiers: A bullish reversal pattern consisting of three consecutive long-bodied candles that close higher than the previous day’s close. This pattern indicates strong buying pressure.
- Three Black Crows: A bearish reversal pattern made up of three consecutive long-bodied candles that close lower than the previous day’s close. This pattern indicates strong selling pressure.
- Bullish Harami: A two-candle pattern where a large bearish candle is followed by a smaller bullish candle that is completely inside the body of the first candle. It suggests a potential reversal to the upside.
- Bearish Harami: The opposite of the bullish harami, this pattern features a large bullish candle followed by a smaller bearish candle, suggesting a potential reversal to the downside.
How to Use Candlestick Patterns in Trading
- Identify Trends: Begin by analyzing the overall market trend. Are prices moving up, down, or sideways? Understanding the trend will help you contextualize the significance of the candlestick patterns.
- Look for Confirmation: While candlestick patterns can indicate potential reversals or continuations, it’s essential to look for confirmation before making a trade. This could be additional candlesticks, indicators (like RSI or MACD), or chart patterns.
- Set Entry and Exit Points: Use candlestick patterns to determine where to enter and exit trades. For example, if you spot a bullish engulfing pattern after a downtrend, consider entering a long position, setting a stop-loss just below the recent low to manage risk.
- Combine with Other Analysis: To increase the probability of successful trades, combine candlestick analysis with other technical analysis tools, such as support and resistance levels, moving averages, or trend lines.
Tips for Practicing Candlestick Analysis
- Use Historical Charts: Practice identifying candlestick patterns on historical charts to familiarize yourself with how they form and what they signify.
- Keep a Trading Journal: Document your trades and the candlestick patterns that influenced your decisions. This will help you analyze your performance and refine your trading strategy over time.
- Start Small: If you're new to trading, consider starting with a demo account or trading with a small amount of capital until you gain confidence in your candlestick analysis skills.
- Stay Updated: Markets are constantly changing. Keeping abreast of market news and trends can help you better interpret candlestick patterns in real time.
Conclusion
Reading candlesticks is an essential skill for traders and investors looking to understand market movements and make informed trading decisions. By grasping the components of candlesticks, recognizing key patterns, and applying them in your trading strategy, you can enhance your market analysis and improve your trading results. Remember, practice is vital—take the time to study candlestick patterns on historical charts and develop your trading strategy around them. With patience and dedication, you'll become more proficient in interpreting candlestick charts and utilizing them effectively in your trading endeavors.
Final Thoughts
As you become more comfortable with candlestick analysis, consider integrating other forms of technical analysis into your trading strategy. Indicators like moving averages, Bollinger Bands, and momentum indicators can complement your candlestick patterns, providing a more comprehensive view of market conditions. Always remember to practice good risk management and never invest more than you can afford to lose. Happy trading!
