Financial astrology for S&P 500 and Nasdaq forecasting is becoming an increasingly discussed subject among traders, investors, market researchers, and timing-focused analysts. In modern financial markets, price is influenced by earnings, liquidity, interest rates, inflation expectations, economic data, institutional flows, technology trends, and global sentiment. Yet, many experienced traders also know that markets do not move only in straight lines. They move in cycles. They rise with confidence, pause during uncertainty, correct when fear expands, and recover when sentiment resets. Financial astrology studies these timing cycles through the movement of planets, lunar phases, eclipses, retrogrades, and long-term celestial alignments.
The S&P 500 and Nasdaq are two of the most watched stock market indices in the world. The S&P 500 reflects broad American corporate strength across sectors such as technology, healthcare, financials, industrials, energy, consumer goods, and communication services. The Nasdaq, on the other hand, has a heavier technology and growth-stock character. It often reacts more sharply to interest rates, innovation cycles, artificial intelligence trends, semiconductor demand, liquidity conditions, and investor appetite for future earnings. Because these two indices represent both broad market confidence and high-growth speculation, they are useful instruments for studying financial astrology.
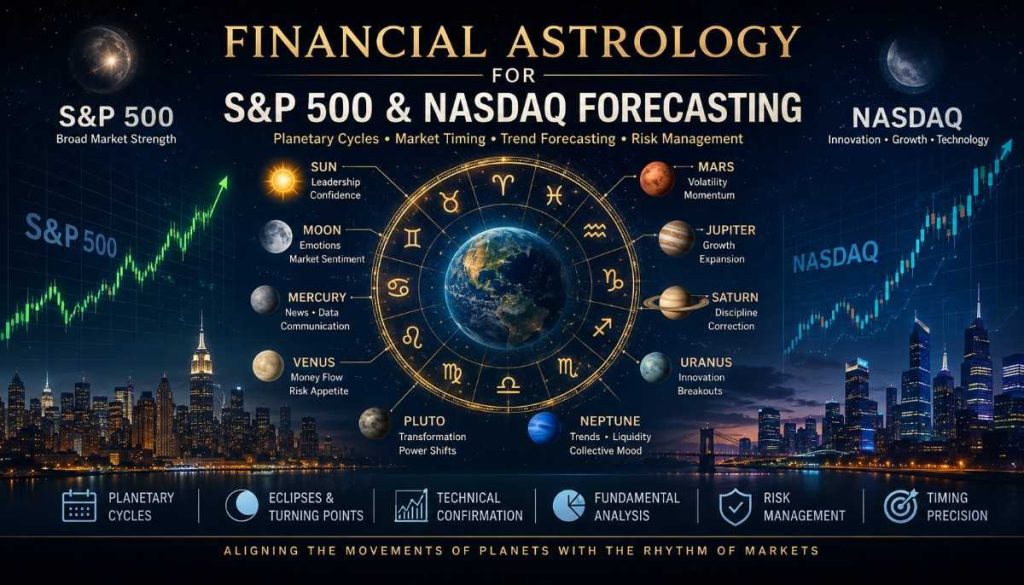
Financial astrology does not replace technical analysis, fundamental analysis, valuation research, macroeconomic study, or risk management. Instead, it adds a timing layer. It helps traders ask a different kind of question. Rather than only asking whether the market is expensive or cheap, financial astrology asks when market psychology may change. Rather than only asking whether a trend is strong or weak, it asks whether a certain time window carries higher probability of volatility, reversal, acceleration, or exhaustion. This makes it especially relevant for S&P 500 forecasting and Nasdaq forecasting, where timing often matters as much as direction.
What Is Financial Astrology in Stock Market Forecasting?
Financial astrology is the study of planetary cycles and their possible correlation with market behavior. It is based on the idea that human psychology moves in waves, and markets are collective expressions of human psychology. When investors become optimistic, markets rise. When fear spreads, markets decline. When uncertainty dominates, markets become volatile. Financial astrology attempts to understand these changes by observing celestial patterns that have historically coincided with shifts in sentiment, liquidity, and risk appetite.
In the context of S&P 500 and Nasdaq forecasting, financial astrology focuses on broad index direction rather than individual company performance alone. This is important because indices capture collective behavior. The S&P 500 reflects the health of corporate America, while the Nasdaq reflects the market’s appetite for growth, innovation, and future potential. When planetary cycles indicate expansion, confidence, liquidity, or speculative enthusiasm, growth-heavy indices like Nasdaq may respond strongly. When cycles indicate restriction, fear, correction, or defensive positioning, the S&P 500 and Nasdaq may both experience pressure, though the Nasdaq usually tends to react more sharply.
The core purpose of financial astrology is not to claim exact certainty. No serious market method can guarantee future prices. Even the strongest earnings model or technical setup can fail when unexpected news appears. Financial astrology works best when it is used as a probability-based framework. It can identify periods when traders should be more alert, reduce overconfidence, manage leverage, protect profits, or prepare for trend changes. In this way, it becomes a practical timing tool for investors who want a broader understanding of market cycles.
Why the S&P 500 and Nasdaq Are Important for Financial Astrology
The S&P 500 and Nasdaq are not only American indices. They are global sentiment indicators. When the S&P 500 trends higher, global investors often view it as a sign of confidence in the U.S. economy and corporate earnings. When the Nasdaq rallies, it often reflects optimism about technology, innovation, artificial intelligence, cloud computing, semiconductors, software, digital platforms, and future productivity. These indices influence global equities, exchange-traded funds, pension portfolios, hedge fund strategies, retail investor behavior, and institutional asset allocation.
From a financial astrology perspective, the S&P 500 and Nasdaq are ideal for cycle analysis because they respond strongly to both macroeconomic and psychological forces. Interest rate expectations can shift market direction quickly. Federal Reserve policy, inflation data, bond yields, earnings surprises, geopolitical tension, liquidity trends, and currency movements can all trigger major moves. However, these events often occur within broader timing patterns. Financial astrology studies whether planetary cycles align with these sensitive windows.
For example, a strong market rally may continue for months, but if that rally reaches a major planetary stress period near an eclipse, Mercury retrograde, Mars-Saturn tension, or a Jupiter-Saturn cycle shift, a trader may become more cautious. This does not mean the market must fall. It means the probability of volatility, profit booking, or trend reassessment may increase. Similarly, if a correction reaches a timing window linked with stabilization, support, or renewed confidence, traders may watch for a possible bottom formation.
The Role of the Sun in Market Leadership
In astrology, the Sun represents confidence, authority, leadership, visibility, power, and central direction. In financial astrology, solar movements can be studied to understand market leadership and investor confidence. Since the S&P 500 represents the core of American corporate strength, solar cycles can be relevant when analyzing broad index behavior.
When the Sun forms harmonious relationships with growth-oriented planets such as Jupiter, market confidence may improve. Traders may become more willing to take risk, institutions may increase exposure, and broader indices may show strength. When the Sun forms difficult relationships with restrictive or disruptive planets, confidence may weaken. Investors may question valuations, react strongly to policy signals, or reduce risk exposure.
For Nasdaq forecasting, the Sun can represent leadership within high-growth sectors. Technology stocks often depend on investor confidence in future earnings. If solar patterns support visibility and optimism, market leaders in artificial intelligence, semiconductors, software, and digital infrastructure may attract strong flows. If solar patterns suggest pressure or uncertainty, leadership stocks may face rotation, correction, or consolidation.
FAQs on Financial Astrology for S&P 500 and Nasdaq Forecasting
Learn how planetary cycles, lunar phases, retrogrades, and market timing principles can be used as an additional research layer for S&P 500 and Nasdaq forecasting.
Financial astrology for S&P 500 and Nasdaq forecasting studies how planetary cycles, lunar phases, eclipses, and retrogrades may align with market sentiment, volatility, and turning points. It does not replace technical or fundamental analysis. Instead, it works as a timing layer that helps traders identify sensitive market windows.
Astrology cannot guarantee the exact future price of the S&P 500. However, financial astrology can help identify periods when market confidence, risk appetite, volatility, or correction pressure may increase. Traders often combine these timing windows with chart patterns, macro data, and risk management.
Nasdaq is strongly linked with technology, growth stocks, artificial intelligence, semiconductors, software, and future earnings expectations. Financial astrology studies planets such as Uranus, Mercury, Jupiter, Saturn, and Neptune to understand possible shifts in innovation cycles, liquidity, speculation, and valuation pressure.
Jupiter is often linked with expansion and optimism, while Saturn represents discipline, restriction, and correction. Mercury connects with news, data, and trading communication. Mars can increase volatility and aggressive price action. Uranus is associated with technology, disruption, and sudden market moves, making it especially relevant for Nasdaq forecasting.
Lunar phases can be useful for short-term sentiment analysis. New Moons may mark fresh emotional cycles, while Full Moons can coincide with heightened reactions, volatility, or market turning points. Traders usually study lunar phases together with price levels, volume, trend strength, and macro events.
Mercury retrograde is often associated with revisions, confusion, delays, false signals, and changing narratives. In market timing, this period may increase the chance of sudden reversals, data misinterpretation, or unclear communication from companies and policymakers. It is often a time to wait for stronger confirmation.
Financial astrology may help identify high-risk windows when volatility, fear, or systemic pressure could increase. However, no method can guarantee the exact timing of a market crash. A responsible approach uses astrology along with macroeconomic analysis, valuation study, technical breakdowns, liquidity conditions, and proper portfolio protection.
Yes, long-term investors can use financial astrology to understand broader market cycles, possible correction periods, and favorable accumulation windows. It may help investors avoid emotional buying near overextended phases and become more patient during uncertain periods.
Traders can use financial astrology to mark important timing windows and then use technical analysis for confirmation. For example, if a planetary stress period appears while Nasdaq is near resistance and momentum is weakening, traders may watch for rejection or bearish divergence. If a supportive cycle appears near strong support, traders may look for reversal confirmation.
Financial astrology is not considered scientifically proven in the same way as traditional financial models. It is better understood as a historical, symbolic, and cycle-based timing discipline. Serious traders should use it as a supplementary tool, not as a standalone trading system.
The Moon, Lunar Phases, and Short-Term Market Sentiment
The Moon is one of the most important bodies in financial astrology because it moves quickly and reflects emotional changes. Markets often move not only because of data but because of how traders feel about the data. The Moon represents instinct, liquidity, public mood, reactions, and short-term sentiment. Therefore, lunar cycles are often studied for intraday, daily, and weekly market timing.
New Moons can symbolize fresh starts, new sentiment phases, and early trend formation. Full Moons can bring emotional peaks, volatility, reversals, or turning points. This does not mean every New Moon creates a rally or every Full Moon creates a fall. Instead, these phases become important when they align with key technical levels, earnings periods, central bank decisions, or major planetary aspects.
For S&P 500 forecasting, lunar phases can help traders observe when broad market sentiment may shift. If the index is already overbought near a Full Moon and negative macro news appears, profit booking may become sharper. If the index is oversold near a New Moon and supportive data arrives, a relief rally may develop. For Nasdaq forecasting, lunar phases can be even more sensitive because growth stocks often react strongly to changes in investor emotion and liquidity expectations.
Mercury Retrograde and Market Communication
Mercury rules communication, data, contracts, trading systems, analysis, news flow, and interpretation. In financial markets, Mercury-related periods can be important because traders rely heavily on information. Earnings guidance, inflation reports, Federal Reserve commentary, analyst upgrades, technology announcements, and economic data all depend on communication.
Mercury retrograde is often associated with confusion, revisions, delays, misinterpretation, and reassessment. In stock market forecasting, this period does not automatically mean markets will decline. However, it can increase the chance of false breakouts, sudden reversals, mixed signals, delayed decisions, and changing narratives. Traders may see markets react strongly to one interpretation and then reverse when new information emerges.
For the S&P 500, Mercury retrograde can bring confusion around economic data, policy expectations, and earnings commentary. For the Nasdaq, it can affect technology narratives, product announcements, regulatory developments, and valuation expectations. During such periods, traders may benefit from waiting for confirmation before assuming that a breakout or breakdown is permanent.
Venus and Risk Appetite in Growth Stocks
Venus represents value, comfort, luxury, beauty, attraction, money flow, and harmony. In financial astrology, Venus can relate to investor appetite for attractive assets. When Venus is strong or well-supported, markets may display smoother sentiment, better liquidity, and improved willingness to hold risk assets. This can support both the S&P 500 and Nasdaq, especially when technical structures are already bullish.
The Nasdaq may respond strongly to Venus-related themes because growth stocks often need investor attraction. When money flows toward innovation, digital platforms, artificial intelligence, and high-quality technology names, the Nasdaq can outperform. Venus periods can also support consumer discretionary stocks, luxury brands, design-led companies, entertainment platforms, and digital economy businesses.
However, difficult Venus aspects may suggest valuation concerns, disappointment, or fading attraction. In such periods, richly valued growth stocks can face pressure. This is especially important for Nasdaq forecasting because technology stocks often trade on future expectations. If investor attraction weakens, even strong companies can correct.
Mars and Volatility in S&P 500 and Nasdaq
Mars represents action, aggression, speed, competition, conflict, and risk-taking. In financial astrology, Mars is closely connected with volatility. When Mars forms strong or difficult aspects with outer planets, markets may become more reactive. Traders may see sharp intraday swings, breakout attempts, panic selling, short covering, or sudden sector rotation.
For the S&P 500, Mars periods may increase market intensity around macro events. If inflation data, employment reports, Federal Reserve statements, or geopolitical news appear during active Mars periods, price reactions may become stronger than usual. For the Nasdaq, Mars can amplify momentum in both directions. It can support powerful rallies when risk appetite is strong, but it can also trigger sharp declines when fear rises.
Mars is especially important for short-term traders. It can indicate periods when stop-loss discipline becomes essential. High leverage during Mars-driven volatility can be dangerous because price movement may become fast and emotional. A careful trader may use Mars periods to prepare for wider ranges, faster execution, and stricter position sizing.
Jupiter and Bullish Expansion Cycles
Jupiter is one of the most important planets for market optimism. It represents expansion, growth, confidence, abundance, opportunity, speculation, and belief in the future. In financial astrology, strong Jupiter periods often support bullish sentiment, especially when macroeconomic conditions are favorable.
For the S&P 500, Jupiter may support broad market rallies, earnings optimism, improved investor confidence, and expansion in multiple sectors. For the Nasdaq, Jupiter can be especially powerful because technology and growth stocks depend heavily on future expectations. When investors believe that future earnings, innovation, and productivity will expand, Nasdaq companies can attract strong capital flows.
However, Jupiter also has a speculative side. It can create overconfidence, excessive valuations, and market bubbles when optimism becomes too strong. Therefore, Jupiter cycles should be read carefully. A Jupiter-supported rally can be profitable, but late-stage Jupiter enthusiasm may also warn traders to avoid emotional buying near stretched levels. The best use of Jupiter in S&P 500 and Nasdaq forecasting is to identify expansion windows while still respecting valuation and technical risk.
Saturn and Market Discipline
Saturn represents discipline, limits, responsibility, structure, fear, delay, debt, regulation, and reality checks. In financial astrology, Saturn is often connected with market corrections, valuation pressure, slower growth, and institutional caution. It does not always create bearish outcomes, but it forces markets to become more realistic.
For the S&P 500, Saturn periods may bring focus on earnings quality, debt levels, margins, interest rates, and economic slowdown risks. Companies with weak balance sheets may underperform, while stable cash-flow businesses may attract defensive interest. For the Nasdaq, Saturn can be more challenging because growth stocks often depend on future earnings. When discount rates rise or investors become more disciplined, high-valuation technology stocks may face pressure.
Saturn is not only negative. It can also create strong long-term foundations. A market correction during a Saturn period may remove excess speculation and prepare the next healthy advance. For investors, Saturn periods are useful for reviewing risk, reducing emotional trading, focusing on quality, and avoiding overextended positions.
Uranus and Technology-Led Market Surprises
Uranus represents innovation, disruption, electricity, technology, sudden change, rebellion, and unexpected events. It is especially relevant for Nasdaq forecasting because the Nasdaq is deeply connected with technology and innovation. Artificial intelligence, cloud computing, semiconductors, cybersecurity, electric vehicles, robotics, biotech platforms, and digital infrastructure all carry Uranian themes.
When Uranus is active, technology stocks may experience sudden breakthroughs, sharp rallies, unexpected corrections, or major narrative shifts. A company may announce a new product, a regulatory event may change expectations, or investors may suddenly reprice an entire sector. Uranus periods can be exciting but unstable.
For the S&P 500, Uranus can influence market leadership. If technology giants carry the index higher, Uranian cycles may coincide with major leadership shifts. However, Uranus can also create market shocks. It can bring sudden volatility when investors least expect it. For this reason, financial astrology treats Uranus as a planet of surprise. Traders should avoid assuming that calm conditions will continue during strong Uranian windows.
Neptune and Market Illusion
Neptune represents dreams, confusion, liquidity, imagination, uncertainty, illusion, and collective belief. In financial astrology, Neptune can be linked with bubbles, unclear narratives, unrealistic expectations, or market movements driven by hope rather than facts. It can also support visionary sectors, creative industries, media, technology imagination, and speculative themes.
For Nasdaq forecasting, Neptune is important because many growth stories depend on future dreams. Artificial intelligence, virtual worlds, biotech breakthroughs, space technology, and disruptive platforms often require investors to believe in a long-term vision. When Neptune supports market sentiment, speculative growth themes may attract attention. However, when Neptune becomes difficult, disappointment can follow. Investors may realize that a story has moved ahead of earnings reality.
For the S&P 500, Neptune may create unclear macro narratives. Markets may struggle to interpret inflation, employment, policy, or geopolitical signals. During Neptune periods, traders should be careful with rumors, exaggerated claims, and emotional narratives. Confirmation becomes more important than prediction.
Pluto and Deep Market Transformation
Pluto represents transformation, power, destruction, rebirth, hidden forces, control, and deep structural change. In financial astrology, Pluto can coincide with major shifts in economic systems, institutional power, regulation, debt structures, currency confidence, and long-term market leadership.
For the S&P 500, Pluto periods may indicate deeper changes in corporate power, government policy, taxation, regulation, or financial system structure. For the Nasdaq, Pluto can relate to the rise and fall of dominant technology platforms. It can mark periods when old leadership breaks down and new leadership emerges.
Pluto does not usually operate like a quick trading signal. It works through long cycles. It can show where deep transformation is taking place. Investors studying S&P 500 and Nasdaq forecasting may use Pluto to understand long-term themes such as artificial intelligence dominance, semiconductor supply chains, digital surveillance, cybersecurity, energy transition, monetary restructuring, and the concentration of market power.
Eclipses and Major Turning Points
Eclipses are among the most watched events in financial astrology. Solar and lunar eclipses often coincide with heightened emotional intensity, major news cycles, leadership changes, and sudden shifts in direction. In market forecasting, eclipses are not used as simple buy or sell signals. Instead, they are treated as sensitive windows.
When an eclipse occurs near important planetary aspects or near major technical levels in the S&P 500 or Nasdaq, traders may watch for increased volatility. A market that has been rising strongly may begin to show exhaustion. A market that has been falling may start forming a bottom. A sideways market may break out or break down.
Eclipse effects can unfold before and after the exact date. This makes them useful for planning rather than reacting. Traders may mark eclipse windows on their calendar and compare them with earnings seasons, Federal Reserve meetings, inflation reports, and index chart patterns. When multiple timing factors align, the forecasting value becomes stronger.
Combining Financial Astrology with Technical Analysis
Financial astrology becomes more practical when combined with technical analysis. A planetary cycle may suggest a possible reversal window, but the chart must confirm it. If the S&P 500 is near resistance during a difficult planetary period, traders may watch for rejection, bearish divergence, or volume weakness. If the Nasdaq is near support during a supportive planetary period, traders may watch for reversal candles, improving breadth, or momentum recovery.
Technical analysis shows what price is doing. Financial astrology suggests when price may become more sensitive. Together, they create a more complete decision-making framework. A trader can use moving averages, trendlines, support and resistance, RSI, MACD, volume, breadth indicators, volatility indices, and sector rotation tools along with planetary timing.
For example, if the Nasdaq is in a strong uptrend and a Jupiter-supported window appears, traders may continue to respect the trend. However, if the same rally becomes overextended near an eclipse and Mars-Saturn pressure appears, they may reduce risk or protect profits. This balanced approach avoids blind prediction and encourages disciplined market timing.
Explore Rajeev Prakash Investor Tools
Choose the right financial astrology product for market timing, research, live signals, and daily investor guidance.
Annual Letter 2026
Read the yearly market timing roadmap based on financial astrology, planetary cycles, equities, precious metals, and key investment risk windows.
Explore Annual Letter
Live Signals
Get live trading and investment timing guidance using planetary cycles, technical levels, real-time price movement, and risk windows.
View Live Signals
Daily Newsletter
Start your trading day with daily market bias, financial astrology insights, risk alerts, planetary timing zones, and important levels to watch.
Subscribe Now
Financial Astrology Terminal
Use the Financial Astrology Terminal to track global assets, market cycles, planetary timing windows, watchlists, and financial astrology signals.
Open TerminalCombining Financial Astrology with Fundamental Analysis
Fundamental analysis remains essential for long-term investing. Earnings, revenue growth, margins, free cash flow, valuation, interest rates, productivity, and economic data all matter. Financial astrology should not ignore these realities. Instead, it can help investors understand when markets may respond more strongly to fundamental information.
For the S&P 500, fundamentals include broad earnings growth, consumer strength, inflation trends, credit conditions, and corporate guidance. For the Nasdaq, fundamentals include technology spending, chip demand, software growth, AI adoption, cloud infrastructure, and interest rate sensitivity. Financial astrology can help identify periods when these fundamentals may be repriced.
A strong earnings season during a supportive Jupiter or Venus period may lead to a powerful rally. A weak earnings season during a Saturn or Mars pressure period may trigger a sharper correction. The same data can produce different market reactions depending on sentiment and timing. This is where financial astrology adds value.
S&P 500 Forecasting Through Sector Rotation
The S&P 500 is a broad index, so sector rotation is important. Financial astrology can help study which sectors may gain or lose strength during different planetary periods. Jupiter may support expansion sectors, financial optimism, travel, education, and global growth themes. Saturn may favor defensive sectors, infrastructure, utilities, healthcare, and companies with stable cash flow. Venus may support luxury, consumer brands, design, entertainment, and beauty-related businesses. Mars may activate energy, defense, industrials, and high-beta trading activity. Uranus may support technology, semiconductors, artificial intelligence, and disruptive innovation.
When forecasting the S&P 500, traders should not only ask whether the index will rise or fall. They should also ask which sectors may lead. A market can remain strong even when leadership changes. If technology cools but financials, industrials, or healthcare strengthen, the S&P 500 may continue higher. If leadership becomes narrow and only a few mega-cap names support the index, risk may increase. Financial astrology can help traders study these leadership transitions through planetary themes.
Nasdaq Forecasting and the Technology Cycle
The Nasdaq is highly sensitive to innovation cycles. It often performs well when investors believe in future growth, low borrowing costs, strong liquidity, and technological transformation. It can struggle when rates rise, valuations compress, or investors move toward defensive assets.
Financial astrology for Nasdaq forecasting pays close attention to Uranus, Mercury, Jupiter, Saturn, and Neptune. Uranus connects with technology breakthroughs and sudden disruption. Mercury connects with communication, software, data, and digital systems. Jupiter supports growth optimism. Saturn pressures high valuations and demands earnings discipline. Neptune can inflate visionary themes but also create confusion or disappointment.
This makes the Nasdaq both exciting and risky. It can move faster than the S&P 500 during bullish periods, but it can also correct more sharply during risk-off phases. Traders using financial astrology for Nasdaq forecasting should focus on timing windows, liquidity conditions, and technology leadership. When planetary cycles support innovation and optimism, Nasdaq momentum can become powerful. When restrictive cycles dominate, traders should become more selective.
Market Timing and Risk Management
The true value of financial astrology is not only prediction. It is risk awareness. A trader does not need to know the exact future to improve decision-making. Even knowing that a certain time window may bring higher volatility can be useful. It can help traders reduce position size, avoid emotional entries, tighten stop-loss levels, or wait for better confirmation.
For S&P 500 and Nasdaq traders, risk management is essential because both indices can move quickly during major events. A financial astrology calendar can highlight sensitive dates, but trades must still be managed with discipline. No planetary signal should justify reckless leverage. No forecast should replace stop-loss rules. No timing window should be treated as guaranteed.
Professional investors can use financial astrology as a secondary timing layer. They may already have macro models, valuation systems, quantitative tools, and technical dashboards. Financial astrology can add another dimension by identifying potential turning points that may not appear in traditional models. The best use is not blind belief, but structured observation.
How RajeevPrakash.com Can Use This Approach
A page on financial astrology for S&P 500 and Nasdaq forecasting can become a strong educational and conversion-focused landing page for RajeevPrakash.com. It should explain financial astrology in a practical way while showing how market timing can support better decisions. The page can connect naturally with annual market outlooks, live signals, financial astrology newsletters, and the Financial Astrology Terminal.
Visitors searching for S&P 500 forecast, Nasdaq forecast, financial astrology stock market, astrology market timing, planetary cycles in stock market, and financial astrology for traders are usually looking for direction, timing, and confidence. The content should guide them from curiosity to understanding. It should show that financial astrology is not a magic shortcut. It is a time-cycle discipline that works best with chart analysis, macro awareness, and risk control.
The page can also position Rajeev Prakash as a specialist in financial astrology and market timing. It can explain that institutional investors, family offices, and serious traders do not need more noise. They need better timing, clearer risk windows, and a disciplined way to prepare for market turns. This message fits well with products such as the Annual Letter, live signals, premium newsletters, and the Financial Astrology Terminal.
Practical Example of a Forecasting Framework
A useful forecasting framework for the S&P 500 and Nasdaq can begin with the macro trend. First, observe whether the market is in a bullish, bearish, or sideways phase. Then review technical levels such as support, resistance, moving averages, momentum, and breadth. After that, study the planetary calendar. Look for New Moons, Full Moons, eclipses, Mercury retrograde phases, Mars pressure periods, Jupiter expansion windows, Saturn reality-check phases, and Uranus disruption zones.
Once these timing windows are identified, compare them with market events. Are inflation numbers due near an eclipse? Is a Federal Reserve decision happening during Mercury retrograde? Are major technology earnings arriving during a Uranus aspect? Is the Nasdaq overbought during a Mars-Saturn period? Is the S&P 500 testing support during a Jupiter-Venus supportive window? These combinations create better forecasting context.
The final step is risk management. A timing window should lead to preparation, not impulsive action. Traders can create scenarios. If the market breaks above resistance during a supportive period, bullish continuation becomes more likely. If it fails near resistance during a difficult period, correction risk increases. If the market reaches support during a stabilizing period, a rebound may become possible. This scenario-based method is more professional than making rigid predictions.
Why Traders Need a Timing Layer
Most traders focus on price, news, and indicators. These are important, but they often react after the move has already started. A timing layer helps traders prepare before volatility arrives. Financial astrology provides such a layer by studying cycles that may influence collective psychology.
The S&P 500 and Nasdaq often move before headlines fully explain why. Markets discount the future. They sense changes in liquidity, policy, earnings expectations, and sentiment early. Financial astrology attempts to map these early changes through planetary cycles. When used carefully, it can help traders avoid being surprised by sudden turns.
This is especially useful for investors who manage large capital. Family offices, hedge funds, portfolio managers, and high-net-worth investors cannot afford emotional decisions. They need structured preparation. A timing layer can help them decide when to add exposure, when to hedge, when to wait, and when to reduce risk. Financial astrology does not remove uncertainty, but it can improve awareness.
Conclusion
Financial astrology for S&P 500 and Nasdaq forecasting offers a unique way to study market timing, sentiment, and risk windows. The S&P 500 reflects broad corporate confidence, while the Nasdaq reflects technology-led growth and future expectations. Both indices respond to economic data, earnings, interest rates, liquidity, and global events. However, they also move through psychological cycles. Financial astrology studies those cycles through the movement of the Sun, Moon, Mercury, Venus, Mars, Jupiter, Saturn, Uranus, Neptune, Pluto, and eclipses.
This approach works best when it remains practical. It should not replace technical analysis, fundamental research, macroeconomic study, or risk management. Instead, it should support them. It can help traders identify sensitive dates, prepare for volatility, recognize possible turning points, and understand when market confidence may rise or fall.