
Financial astrology software represents a fusion of ancient astrological wisdom with modern technological tools, aimed at providing enhanced insights into investment decisions. This comprehensive guide explores the functionalities, benefits, and practical applications of financial astrology software, emphasizing its role in optimizing investment strategies.
Introduction to Financial Astrology Software
Financial astrology software harnesses the principles of astrology to analyze and forecast market trends. It integrates celestial movements, planetary alignments, and astrological cycles with advanced analytical tools to offer investors a unique perspective on financial markets.
Understanding Key Features
- Return on Investment (ROI) Calculator: This tool uses astrological data to evaluate the potential profitability of investments. By factoring in planetary influences, investors can assess the expected returns more comprehensively.
- Risk-Reward Calculator: Assesses the risk-to-reward ratio of investment opportunities, incorporating astrological insights to gauge potential market volatility and economic shifts.
- P/E Ratio Calculator: Calculates the Price-to-Earnings ratio of stocks, integrating astrological analysis to interpret market sentiment and valuation trends.
- Dividend Calculator: Predicts dividend payments based on astrological forecasts and historical dividend trends, assisting investors in dividend-oriented investment strategies.
Benefits of Financial Astrology Software
- Holistic Investment Analysis: Integrates traditional financial metrics with astrological insights, providing a more comprehensive view of market dynamics.
- Timing Market Movements: Predicts optimal times for buying or selling investments based on astrological forecasts, potentially enhancing investment timing and profitability.
- Risk Mitigation: Utilizes astrological data to identify and manage risks associated with market fluctuations and economic cycles.
Practical Applications and Case Studies
Explore real-world examples where financial astrology software has been successfully employed:
- Sector Rotation Strategies: Using astrological insights to identify sectors favored by planetary alignments for strategic portfolio allocation.
- Earnings Season Analysis: Predicting stock price movements during earnings announcements based on astrological forecasts.
- Market Timing for IPOs: Selecting auspicious astrological timings for initial public offerings (IPOs) to optimize investor response and market reception.
Challenges and Considerations
- Subjectivity: Critics argue that financial astrology relies on subjective interpretation of astrological data, potentially leading to biased investment decisions.
- Data Accuracy: Ensuring the accuracy and reliability of astrological data inputs to maintain the effectiveness of predictions and analyses.
Future Trends and Innovations
- Advancements in Astrological Algorithms: Integration of machine learning and AI techniques to enhance the accuracy and predictive power of financial astrology software.
- Growing Acceptance: Increasing adoption of astrological insights by institutional investors and financial analysts as a complementary tool to traditional methods.
Financial Astrology Terminal: Real-Time Markets Meet Planetary Intelligence
The Financial Astrology Terminal brings live market data and precise planetary analytics into one professional workspace. It is built to help investors time entries and exits more confidently by overlaying ephemeris-based signals on intraday and end-of-day charts. The result is a practical, decision-ready view that blends technicals, fundamentals, and cosmic timing without hype.
Introducing the Financial Astrology Terminal
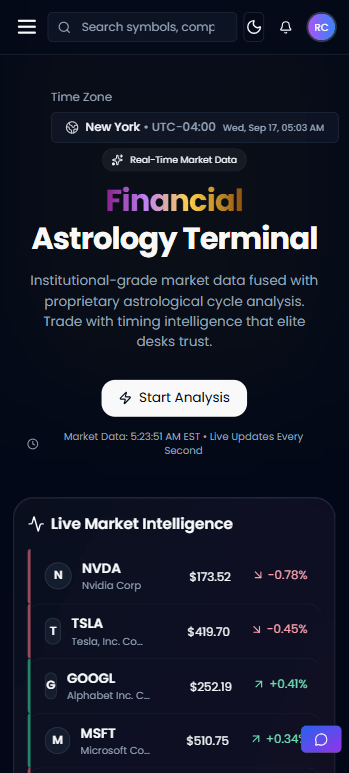
At the heart of modern financial astrology lies the need for real-time, actionable insights. To address this, we developed the Financial Astrology Terminal available at finance.rajeevprakash.com. This cutting-edge platform merges advanced U.S. market data feeds with astrological intelligence, delivering a powerful decision-support tool for traders, investors, and portfolio managers worldwide.
Key Functionalities of the Financial Astrology Terminal
1. Real-Time Market Data
The terminal integrates live U.S. stock market updates, indices, ETFs, and commodities with lightning-fast refresh rates. Quotes, charts, and analytics update seamlessly, ensuring traders never miss an opportunity.
2. Planetary Overlays on Stock Charts
Unlike traditional financial terminals, our system incorporates astrological overlays. Users can visualize planetary transits, retrogrades, and cosmic cycles directly on technical charts—allowing correlations between celestial alignments and market moves to become instantly clear.
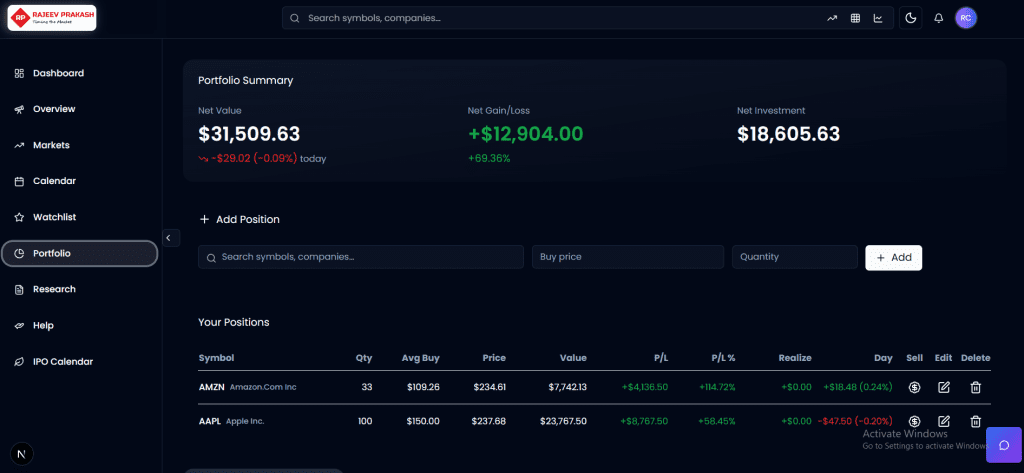
3. Comprehensive Portfolio Tracking
The terminal empowers investors to build, manage, and analyze their portfolios. Each holding is enriched with traditional metrics—price, P/L%, ROI—alongside planetary influence indicators, revealing when cosmic cycles favor holding, exiting, or adding positions.
4. Advanced Watchlists and Alerts
Users can create customized watchlists and set intelligent alerts not only for price and volume thresholds but also for planetary events such as Saturn retrogrades or eclipses. This unique combination helps in spotting high-probability opportunities with astrological confirmation.
5. Deep Research and Insights
The built-in Research Hub blends fundamental data (P/E ratios, earnings calendars, balance sheet insights) with predictive astrological commentary. This dual approach creates a holistic analysis layer that traditional finance platforms simply cannot provide.
What the Terminal Does
The Financial Astrology Terminal unifies price, volume, and corporate events with an always-on transit engine. It streams quotes for major equities and indices, updates earnings, dividends, splits, and economic releases, and simultaneously computes planetary positions, aspects, lunar phases, retrogrades, and ingress windows. On any symbol page you can toggle ephemeris overlays on the chart, see aspect heat maps around your chosen dates, and compare performance across similar planetary setups in the past. A dynamic watchlist and alert center let you track signals as they form rather than after the move.
How It Works Under the Hood
The terminal computes high-precision ephemerides and maps them to market time in your chosen timezone. Each transit or aspect becomes a measurable event with a window and magnitude. The engine then evaluates those events against price history, calculating conditional returns, drawdown statistics, and probability bands. You can inspect the baseline distribution and the event-conditioned distribution so the influence of a cycle is transparent rather than asserted. The system stores these summaries so you can revisit assumptions and compare them with new outcomes as the market evolves.
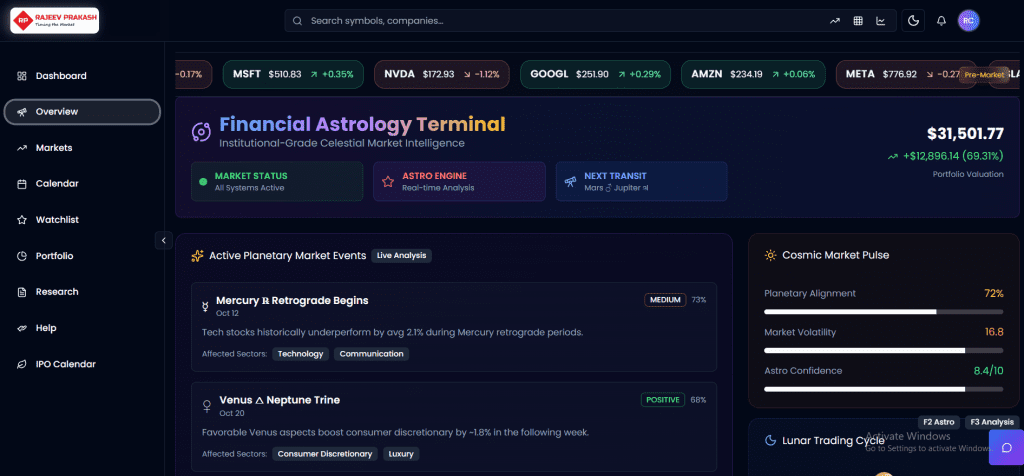
Inside the Workspace
The Dashboard opens with a market snapshot and a rolling “cosmic risk” gauge that reflects the density and strength of near-term aspects. The Calendar shows planetary transits side by side with earnings, dividends, splits, and macro data so you can line up celestial and corporate catalysts. Markets provides symbol search, real-time quotes, and charting with planetary overlays. Research curates notes that combine technical levels, sector context, and transit commentary for a tradeable narrative. Watchlist and Portfolio add authenticated views with price and transit alerts. The IPO Calendar highlights auspicious windows within the listing pipeline and can be compared against historical windows with similar sky patterns.
Analytics You Can Act On
The terminal includes the ROI Calculator, Risk-Reward Calculator, P/E Ratio view, and Dividend tools directly on the symbol page. Each calculation can be viewed through a purely financial lens or with planetary conditioning switched on. That means you can evaluate a setup in conventional terms and then add or remove the astrological filter to see whether timing quality improves. A backtesting panel lets you define event windows such as two days before to five days after an aspect, control for trend or volatility regimes, and view the resulting return curves with confidence bands. You can then save those settings as a strategy template for reuse.
Practical Trading Use Cases
Many users apply the system for sector rotation by mapping long Jupiter transits to quality growth phases and Saturn-weighted periods to disciplined value or income exposure. Swing traders often focus on lunar cycles and Mercury stations for short-duration reversals on high-liquidity names. Event traders align earnings dates with the aspect heat map, prioritising names where the corporate catalyst and the transit cluster coincide. Long-horizon allocators use ingress cycles to scale into positions over several tranches rather than all at once, reducing timing risk while staying aligned with the broader cycle.
Methodology, Transparency, and Review
Every signal in the Financial Astrology Terminal includes sample size, average and median returns, upside and downside tails, and a simple probability statement so you can weigh potential reward against adverse excursion. Historical examples are shown directly on charts with the same planetary configuration, allowing a quick sanity check. The platform encourages post-analysis by comparing previously published views with realised outcomes, building a living track record that users can learn from over time.
Data Integrity, Timezones, and Holidays
Market data refreshes continuously during trading hours and rolls cleanly across sessions. You can select your timezone, including GMT for UK and European readers, and the terminal accounts for market holidays in the return windows. Calculations are deterministic and documented so that another analyst using the same inputs will obtain identical outputs.
Conclusion
Financial astrology software offers investors a valuable toolset for gaining deeper insights into market behavior and making informed investment decisions. By leveraging celestial insights alongside robust analytical tools, investors can potentially gain a competitive edge in navigating the complexities of global financial markets.
Further Exploration
Explore the intriguing connection between astrology and financial markets with insights into Saturn and Mercury retrograde periods. These astrological events are believed to influence market volatility, investor sentiment, and trading behaviors. Discover how understanding these cosmic rhythms can enhance your investment strategies and decision-making processes.
Learn more about the impact of Saturn and Mercury retrograde:
- Saturn Retrograde: Implications for Stocks and Investor Behavior
- Mercury Retrograde and Its Impact on the Stock Market
- Best day to invest in stocks according to Astrology
Dive into the depths of astrology’s role in financial forecasting and market trends today.
