Crypto Through a Macro Lens
Crypto began life as a small, rebellious corner of the financial world, a space where early adopters experimented with new forms of money and decentralisation. Over time, however, Bitcoin and other digital assets have moved closer to the centre of the global risk ecosystem. Today, large traders, funds, and even institutions increasingly view crypto not in isolation, but through a macro lens. They compare Bitcoin to growth equities, track its behaviour against interest rates, and watch how it responds to global liquidity cycles.
When you start viewing crypto through this macro lens, patterns begin to emerge. Bitcoin often rallies when liquidity expands, struggles when real yields rise, and tends to move in step with high beta technology stocks during periods of risk appetite. The goal of this page is to explain those relationships in simple language, then show how dedicated tools such as a BTC–Nasdaq Correlation Tracker, a Liquidity Phase Overlay, Macro Audio Briefs, and Signal Replay Videos can turn those patterns into practical trading support.

Looking at crypto through macro does not remove uncertainty. Markets always retain an element of surprise. What macro analysis can do is give you context. Instead of treating every candle as a mystery, you begin to understand why Bitcoin might be strong or weak at a given moment, and how external forces like the Federal Reserve, the US dollar, or global growth expectations shape the path of crypto prices.
Why macro matters for crypto
In the beginning, many traders believed Bitcoin would trade independently of the traditional financial system. It was presented as a hedge against central banks, a digital form of gold, and a separate monetary universe. Over time, live price action told a more nuanced story. Bitcoin did sometimes behave like a hedge, particularly during currency crises or in countries with high inflation, but on many days it acted like a high beta risk asset that moved with stocks, especially technology shares.
The reason is simple. Most of the large money that flows into crypto comes from participants who are also active in equities, bonds, and foreign exchange. When these participants have strong risk appetite and abundant liquidity, they are more willing to allocate capital to Bitcoin, Ethereum, and even smaller altcoins. When they are worried about recession, high interest rates, or market stress, they pull back from risk and reduce exposure to assets that are seen as volatile.
Macro factors such as interest rates, inflation expectations, real yields, the strength of the US dollar, and central bank balance sheets affect how much risk investors are prepared to take. Crypto sits near the high risk, high reward end of the spectrum. That is why it often responds quickly to changes in those macro indicators. Recognising this connection is the first step towards trading crypto with a more systematic, informed approach.
The evolution of Bitcoin inside the global risk ecosystem
To understand crypto through a macro lens, it helps to follow the journey of Bitcoin from a niche asset to a component of the broader risk ecosystem. In its early years, Bitcoin traded on relatively small exchanges with low liquidity and limited institutional participation. Price moves were dominated by internal factors such as exchange hacks, protocol debates, and regulatory headlines focused on the crypto industry itself.
As time passed, several changes took place. Crypto derivatives markets expanded, with futures and options listed on major venues. Institutional products were launched, giving hedge funds and asset managers easier access. At the same time, macro investors, who were already comfortable trading equity indices, commodities, and currencies, began to explore Bitcoin as a speculative asset and, in some cases, as a store of value.
Advanced Uses Of The Liquidity Phase Overlay
The Liquidity Phase Overlay is not only a visual reference but also a framework for building structured trading rules. Traders can define clear responses for each liquidity phase and commit to those guidelines.
This shift meant that Bitcoin was no longer only reacting to crypto specific news. It started to respond more clearly to broader macro themes. When central banks expanded their balance sheets and interest rates fell, Bitcoin often benefited from the chase for yield and the search for alternative assets. When risk assets sold off during panic episodes, Bitcoin often dropped alongside them as leveraged positions were unwound and participants rushed to raise cash.
Viewing Bitcoin today, it makes more sense to think of it as part digital commodity, part growth asset, and part macro trade on liquidity and risk sentiment. This mixed identity is one reason why a dedicated macro framework is so helpful for traders who want to understand what is driving Bitcoin’s behaviour at any moment.
Key macro forces shaping crypto
Several macro forces regularly influence crypto markets. The first is liquidity. When global central banks expand their balance sheets, keep interest rates low, or provide other forms of support to the financial system, liquidity conditions are usually described as loose or abundant. In such environments, investors feel more comfortable extending risk. They buy growth stocks, high yield credit, and often crypto. When central banks tighten policy, raise rates, or shrink their balance sheets, liquidity conditions become restrictive. Traders become more cautious, and high beta assets like Bitcoin may struggle.
The second major force is the interest rate and yield environment. When real yields, which are interest rates adjusted for inflation, rise sharply, non yielding assets can become less attractive. Bitcoin does not pay interest or dividends. It competes for capital on the basis of price appreciation and narrative value. Higher real yields often put pressure on such assets as investors rotate into safer instruments that now offer better returns. When real yields fall, the opportunity cost of holding Bitcoin is lower, and crypto may attract more inflows.
Designing A Daily Macro Routine For Crypto Traders
A structured daily routine allows traders to integrate macro tools without feeling overwhelmed. The day can begin with a quick review of the Liquidity Phase Overlay to check whether the environment is currently favourable, neutral, or hostile for high beta risk assets. This sets the tone for the day. If conditions are supportive, traders know that long setups may have a higher probability of follow-through. If conditions are tight, they recognise that defensive positioning is more appropriate.
The third force is the behaviour of the US dollar. Bitcoin is usually priced in dollars on global exchanges, so strong dollar rallies can sometimes weigh on crypto. When the dollar appreciates, it can tighten financial conditions for many participants and reduce risk appetite. When the dollar softens, it often supports risk assets across the board, including equities and crypto.
Other macro elements such as inflation trends, growth data, geopolitical stress, and regulatory developments also play significant roles. However, the three themes of liquidity, yields, and the dollar are often the most important anchors that traders watch when viewing crypto through a macro lens.
Bitcoin and Nasdaq as twin expressions of risk
One of the most visible macro relationships in recent years has been the connection between Bitcoin and US technology stocks, especially the Nasdaq index. Both Bitcoin and Nasdaq are seen as growth sensitive assets. When investors believe that innovation and digital transformation will deliver strong future earnings, they often buy software, semiconductor, and internet companies. They also become more willing to allocate to digital assets that sit at the frontier of finance and technology.
The behaviour of Bitcoin and the Nasdaq often moves in the same direction, especially during strong risk on or risk off episodes. When the Federal Reserve signals that rate hikes may slow, or when inflation data comes in softer than expected, technology stocks tend to rally as the discount rate on future earnings falls. Bitcoin frequently rallies at the same time, responding to the improved risk environment. In contrast, when bond yields spike higher and traders worry about tighter policy, both Bitcoin and growth stocks may come under pressure.
This relationship is not fixed. There are periods when crypto decouples from equities, either because of a strong internal narrative such as a halving event, or due to crypto specific risks like exchange failures or regulatory actions. However, many traders have noticed that the longer term trend shows meaningful positive correlation between Bitcoin and major growth indices, especially during periods when macro forces dominate.
For crypto traders, monitoring this relationship is essential. It helps them see whether Bitcoin is trading in line with broader risk sentiment or diverging from it. A structured way to follow this connection is through a BTC–Nasdaq Correlation Tracker.
Meet Our Team
Get to know our dedicated team of experts. With a diverse range of skills and years of experience, we’re committed to providing you with the best market analysis and investment guidance.

Mr. Rajeev Prakash Agarwal
Founder
Expert in financial & personal astrology for 20 years+. Rajeev is a well-known astrologer based in central India who has a deep understanding of both personal and mundane astrology.

Mr. Shashi Prakash Agarwal
Technical Head
Shashi is a technology leader with a strong background in global business.He holds a B. Tech in Computer Science & MBA in Finance from Narsee Monjee Institute of Management Studies, one of the top B-Schools in India.
BTC–Nasdaq Correlation Tracker
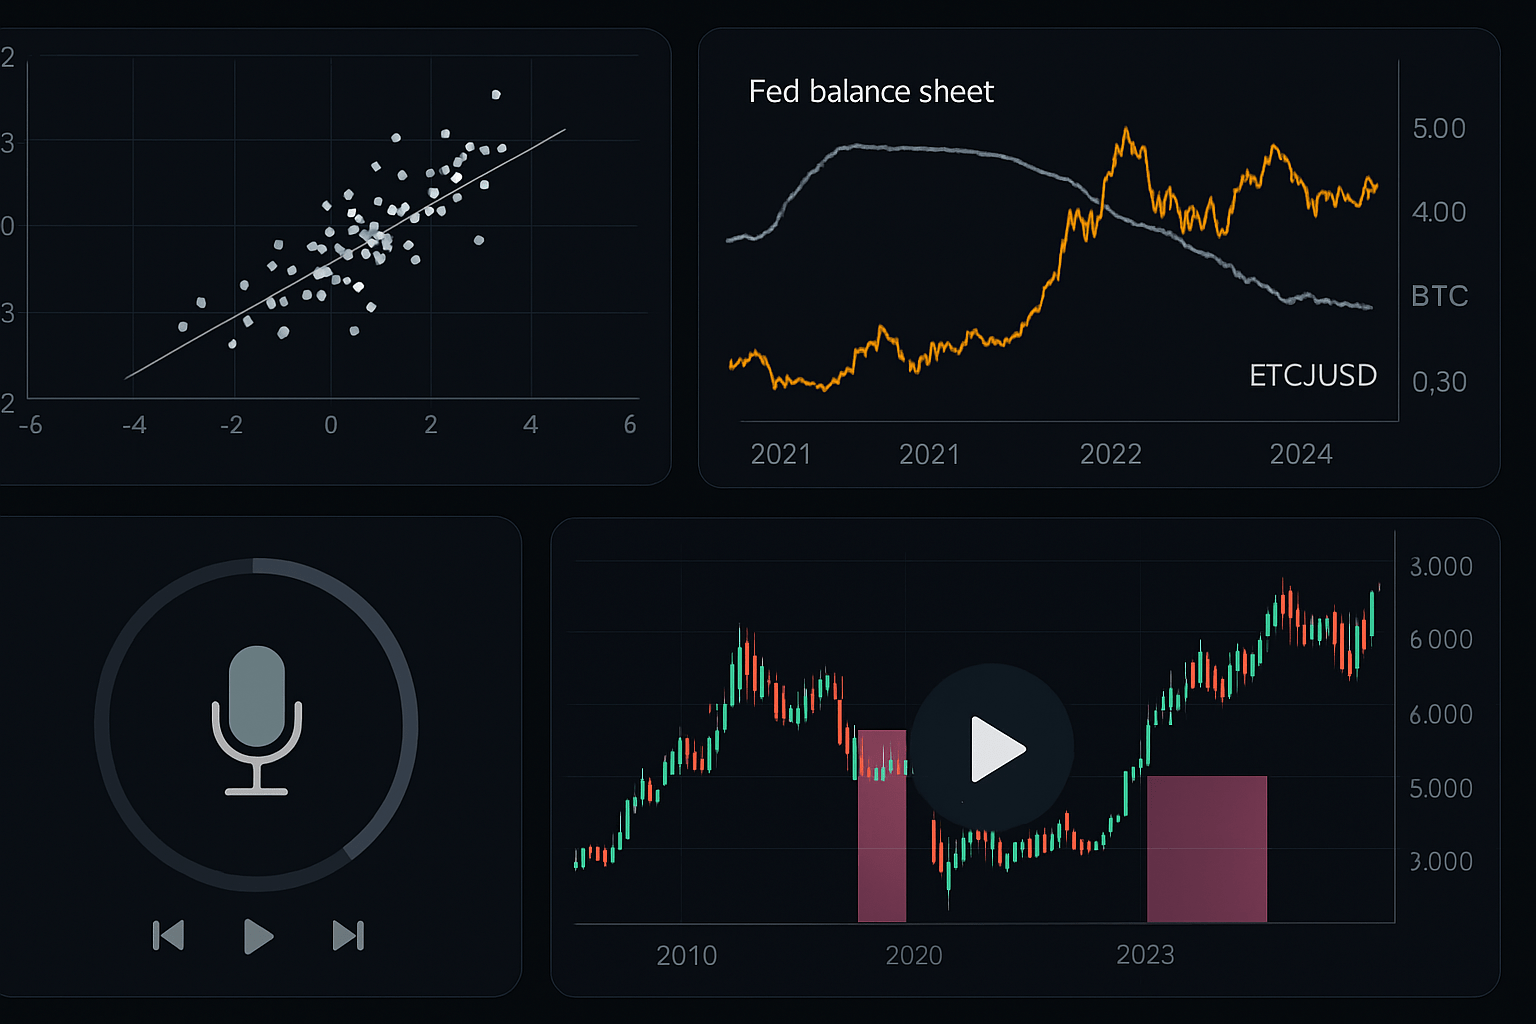
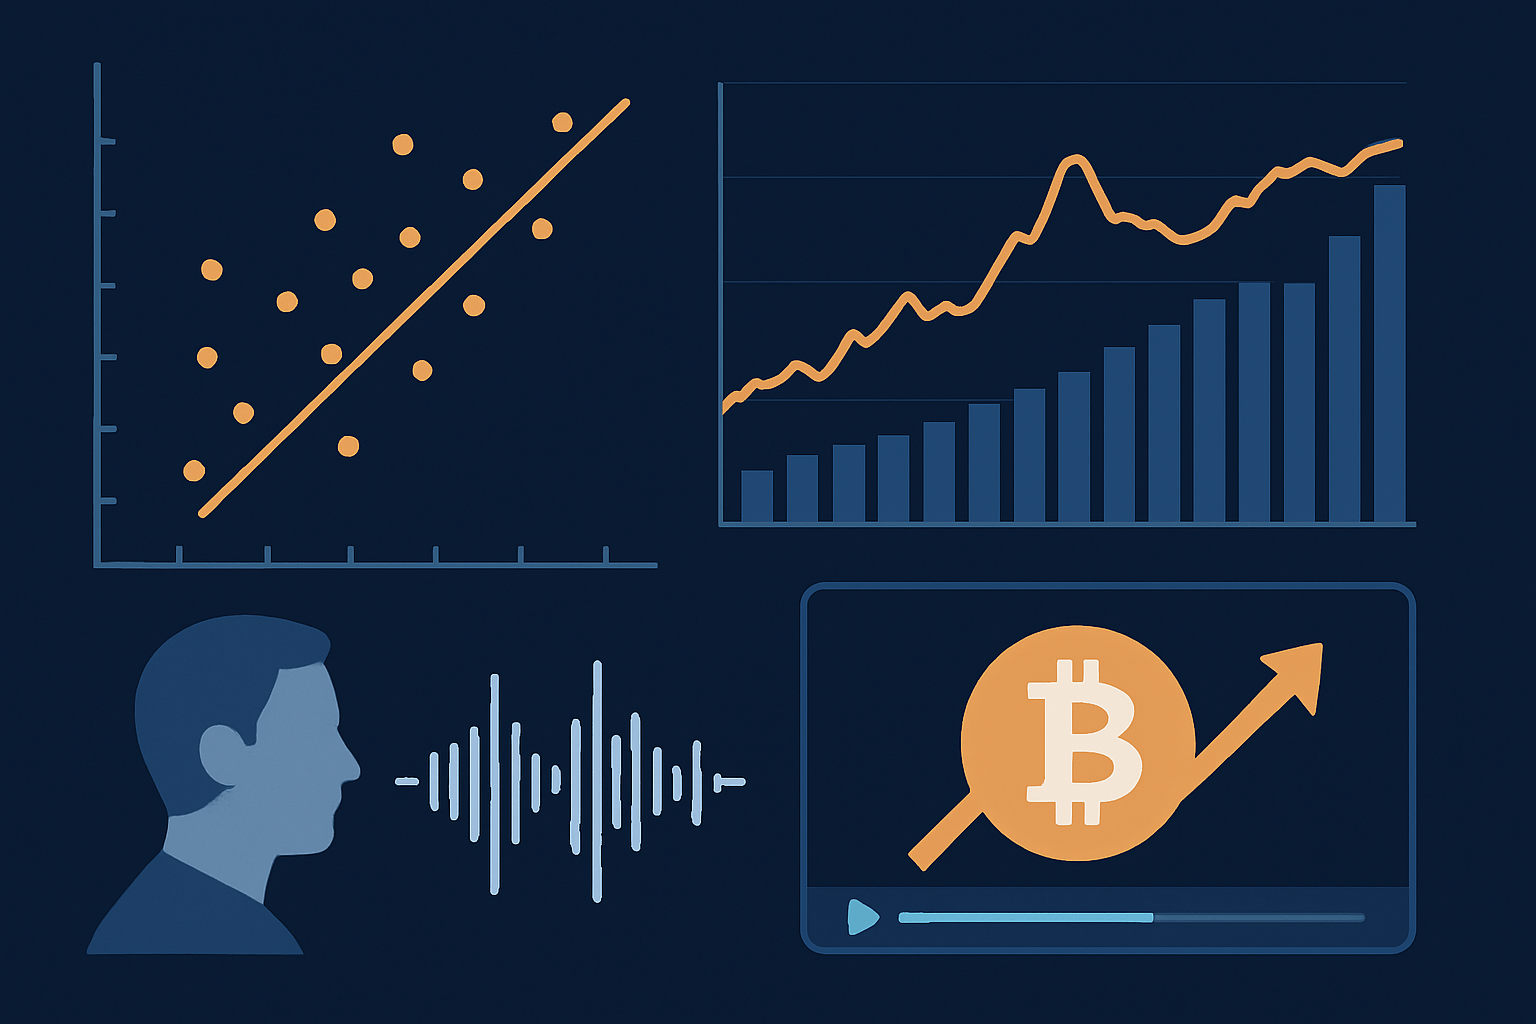
The BTC–Nasdaq Correlation Tracker is a tool designed to visualise in real time how closely Bitcoin is moving with the Nasdaq index. Instead of relying on vague impressions, it calculates a rolling correlation between BTC/USD and the Nasdaq and displays that relationship on a scatter chart or time series view.
In practical terms, the correlation tracker allows traders to answer simple but powerful questions. Is Bitcoin currently trading as a high beta extension of US technology stocks, or has it broken away and started to trade under its own narrative. Are large intraday moves in Bitcoin aligned with shifts in the Nasdaq, or are they triggered by crypto specific flows.
The scatter chart can plot daily changes in Bitcoin against daily changes in the Nasdaq. When the points cluster along an upward sloping line, it suggests that Bitcoin and the Nasdaq are moving together. When the points are scattered without a clear pattern, it points to a weaker relationship. Over time, the system can compute a correlation coefficient and show whether the connection is strengthening or weakening.
For traders, this matters in several ways. When correlation is high and positive, a sharp move lower in the Nasdaq can signal downside risk for Bitcoin as well. When correlation is high and the Nasdaq breaks out to the upside, it may confirm a broader risk on mood that can support crypto. When correlation is low, traders know they must pay even more attention to crypto specific drivers such as on chain flows, regulatory headlines, or internal technical levels.
Building this tool directly into a trading environment ensures that traders do not have to guess about the macro alignment of Bitcoin. They can see at a glance how BTC and major equity indices are interacting and adjust their risk sizing accordingly.
Liquidity Phase Overlay
While correlation tells you how Bitcoin is moving relative to other assets, liquidity conditions help explain why. The Liquidity Phase Overlay is a tool that maps the behaviour of Bitcoin against measures of global liquidity such as the Federal Reserve balance sheet, major central bank actions, or summary indicators of financial conditions.
In this overlay, BTC/USD price action is plotted alongside a scaled representation of the Fed balance sheet or a composite liquidity index. The goal is not to claim a perfect one to one relationship but to help traders visually connect periods of expanding liquidity with crypto bull phases and periods of shrinking liquidity with more challenging conditions for risk assets.
For example, when the Fed expands its balance sheet through asset purchases, liquidity is being added to the system. During such phases, traders might observe that Bitcoin tends to perform well as the new liquidity supports speculative behavior. In contrast, when the Fed runs down its balance sheet, raises rates, or otherwise reduces support, the overlay may show that Bitcoin’s rallies are more fragile, and corrections are deeper.
The Liquidity Phase Overlay does not predict exact price targets. Instead, it segments time into different liquidity regimes such as expansion, neutral, and contraction. Traders can then align their crypto strategies with those regimes. During expansion phases, they may feel more comfortable running larger positions or letting winners ride. During contraction phases, they may reduce exposure, tighten stops, or focus on shorter term trades.
Integrating this tool into a live environment gives traders context with every chart they open. Instead of treating a Bitcoin breakout as an isolated event, they can ask whether it is happening in an environment of growing or shrinking liquidity. That single piece of context can make the difference between chasing a move blindly and participating with a clearer sense of risk.
Macro Audio Brief
Not every trader has the time or desire to read long reports or deep dive into complex macro charts every day. Many simply want a concise explanation of what has changed in the macro backdrop and what it means for crypto. The Macro Audio Brief addresses this need by providing a short voice summary, typically around ninety seconds, that explains recent shifts in crypto correlations and macro drivers.
In a typical Macro Audio Brief, the narrator might start by summarising what happened in key macro markets. For instance, there might be a brief note on whether bond yields moved higher or lower, how the dollar traded, and whether central bank comments were perceived as hawkish or dovish. Then, the brief connects those moves to crypto behaviour, explaining whether Bitcoin strengthened in line with improved risk sentiment, or whether it lagged despite supportive macro signals.
The goal is clarity. A trader listening to the Macro Audio Brief should come away with a simple mental map. They should know whether the current environment is risk on or risk off, whether liquidity conditions are improving or tightening, and how Bitcoin and other key coins are reacting.
Because the brief is delivered in audio form, traders can consume it while preparing charts, commuting, or taking a short break from the screen. It acts as a macro compass for the day, helping them avoid tunnel vision. Instead of reacting only to intraday candles, they remember the bigger picture of yields, liquidity, and equity behaviour that sits behind crypto price action.
Signal Replay Video
One of the best ways to understand how macro truly affects crypto is to watch past events unfold with the benefit of hindsight. That is the purpose of the Signal Replay Video. It takes previous periods of major liquidity shifts or macro turning points and replays what happened to Bitcoin in a structured, educational format.
For example, a Signal Replay Video might focus on three major liquidity shifts. It would show how the Fed’s change in policy or balance sheet direction unfolded, then overlay Bitcoin’s response over days and weeks. The narration would highlight how BTC initially reacted, where traders might have misinterpreted the move, and which signals gave early warnings or confirmations.
By revisiting actual history, traders learn to recognise the patterns that often appear during similar macro shifts. They see how Bitcoin sometimes front runs policy changes, and how it sometimes lags until bond markets and equity indices have already moved. They also learn to appreciate that not every macro event produces the same outcome, which reminds them to remain flexible even while using structured tools.
Signal Replay Videos bridge the gap between theory and practice. It is one thing to read that liquidity matters for Bitcoin. It is much more powerful to watch, on a chart, how Bitcoin reacted during past episodes when liquidity conditions changed. Over time, these replays train a trader’s intuition so that when a new macro event unfolds, they have a mental library of similar situations to draw on.
Macro-Driven Crypto Insights
Navigate Liquidity, Cycles & Global Market Forces
Our macro-focused crypto framework helps you understand how Bitcoin reacts to liquidity shifts, interest-rate cycles, equity correlations, and global risk regimes. Gain clarity, reduce noise, and make smarter long-term decisions in an ever-changing market landscape.
Begin Your Macro-Crypto Journey with Astrodunia’s Insights
Annual letter
Bringing the tools together in a unified macro dashboard
The BTC–Nasdaq Correlation Tracker, Liquidity Phase Overlay, Macro Audio Brief, and Signal Replay Video each provide a different angle on the same core idea. All of them help traders view crypto through a macro lens. When combined into a unified dashboard, they create a powerful environment that reduces noise and clarifies the big picture.
A trader who logs in before the market opens might begin by glancing at the correlation tracker to see whether Bitcoin is trading in sync with the Nasdaq or behaving independently. Then they might look at the liquidity overlay to determine whether the broader environment is supportive or restrictive for risk assets. Next, they could listen to the Macro Audio Brief to hear how recent macro events have impacted crypto correlations.
Later in the day or week, when volatility hits, they could watch Signal Replay Videos of similar past episodes to calibrate their expectations. This routine allows them to anchor their trading decisions in a consistent macro framework rather than being pushed around by every headline or intraday spike.
Using macro insights to shape crypto trading plans
Macro tools are most valuable when they shape concrete trading behaviour. The first way they do this is through position sizing. When the liquidity overlay shows an expansion phase and correlations confirm a supportive risk environment, a trader might be comfortable taking slightly larger positions in Bitcoin and other major coins. When liquidity is contracting and correlations point to stress in equities, they might choose to run smaller positions or focus on short term trades only.
The second way macro tools influence trading is through direction bias. If the macro backdrop is clearly risk on, with falling yields, a softer dollar, and strong equity markets, traders may lean more towards long setups in Bitcoin and be cautious about aggressive shorting. Conversely, if real yields are rising and liquidity is tightening, traders may be more selective with longs and quicker to take profits.
The third way is through expectations for volatility. When macro conditions are calm and supportive, price swings may be more contained, and traders can give positions a bit more room. When macro stress is high, gaps and sharp intraday moves become more likely. In such environments, traders can tighten stops, reduce leverage, or use options structures to manage downside risk.
By integrating macro tools into every stage of the trading process, from idea generation to execution and risk management, traders give themselves a more robust edge. They do not rely solely on micro technical patterns but align those patterns with the broader tides of liquidity and risk sentiment.
Common misconceptions about macro and crypto
There are several misconceptions that often arise when traders first start viewing crypto through a macro lens. One common belief is that macro always dominates and that every move in Bitcoin can be explained by a macro factor. In reality, crypto retains its own internal dynamics. On chain flows, protocol upgrades, regulatory actions, and exchange issues can all generate major moves even when macro conditions appear stable. The goal is to balance awareness of macro with respect for crypto specific signals, not to replace one with the other.
Another misconception is that correlation equals causation. When Bitcoin and the Nasdaq move together, it is tempting to assume that one is directly causing the other to move. In truth, both markets may be responding to shared drivers such as changes in yields or global risk appetite. The BTC–Nasdaq Correlation Tracker helps reveal these shared movements but does not claim that one market is controlling the other. Traders should use correlation as a guide to context, not as a rigid rule.
A third misconception is that macro analysis requires advanced degrees in economics or access to complex institutional research. While those can certainly help, many of the most practical macro signals are straightforward. Watching the direction of real yields, the tone of central bank communication, and a few key indices like the dollar and the Nasdaq can provide enough information to make informed decisions. Tools such as the Macro Audio Brief are specifically designed to translate complex macro themes into accessible language for busy traders.
Building a personal macro playbook for crypto cycles
Every trader can use the concepts on this page to build a personal macro playbook for crypto cycles. The first step is to define which macro indicators matter most for their style. A swing trader might care more about medium term trends in liquidity and yields, while an intraday trader might focus more on how Bitcoin reacts to scheduled economic releases.
The second step is to decide how to interpret different macro regimes. For example, a trader could define what they consider a supportive liquidity environment, what they view as neutral, and what they view as restrictive. They can also decide how strongly they want to adjust their risk in response to each regime.
The third step is to connect that macro framework to clear trading actions. This might include ranges for maximum position size, guidelines for leverage, or criteria for when to stand aside. Over time, traders can refine their playbook by reviewing how well their macro assumptions matched actual market behaviour. Signal Replay Videos are especially useful for this reflection process.
The more consistently a trader applies their macro playbook, the more disciplined their decision making becomes. Instead of reacting emotionally to each price move, they consult their framework, check the tools, and act in line with predefined rules that reflect both macro context and personal risk tolerance.
Future developments in macro driven crypto analytics
The tools described on this page represent a strong foundation, but macro driven crypto analytics continue to evolve. In the future, traders may see even more advanced correlation models that adjust for changing regimes, liquidity overlays that incorporate multiple central banks across regions, and audio or video briefings that adapt dynamically to each user’s portfolio.
Machine learning may help identify subtle shifts in how Bitcoin responds to different macro variables over time, highlighting, for instance, that BTC has become more sensitive to real yields in a particular phase or more responsive to dollar moves in another. These developments will further improve the ability of traders to navigate crypto through a macro lens without drowning in data.
Even as tools become more sophisticated, the core idea remains the same. Crypto does not trade in a vacuum. It lives within the same global system that governs equities, bonds, currencies, and commodities. Understanding that system, and using structured tools to follow its influence on Bitcoin, gives traders a meaningful edge.
Why Choose Us ?
Astrodunia guides you through the market’s ups and downs with the help of planetary science. Our team of experts in financial astrology provide valuable insights and predictions to assist you in market wise investment decisions and navigate the global market with ease.

Market Forecasting
Experience the advantage of enhanced market predictions. Our unique approach combines traditional analysis with astrological insights for more accurate predictions and better investment opportunities.

Decades of Market Timing Expertise
For over 20 years, we’ve honed our skills in market timing within the stock market. Our extensive experience allows us to navigate market trends with precision and confidence.

Trusted by Discerning Investors
Our clients choose us for our proven track record of success and our commitment to providing them with the most reliable market insights. Join the ranks of satisfied investors who trust our expertise
Conclusion
Seeing crypto through a macro lens is about more than adding a few extra charts to your screen. It is about accepting that Bitcoin and other digital assets are part of a broader risk ecosystem shaped by liquidity, yields, and global sentiment. When you recognise this, you start to ask better questions. Instead of only looking at intraday patterns, you ask what the Federal Reserve is doing, how the dollar is behaving, and whether equities are confirming or contradicting crypto’s message.
The BTC–Nasdaq Correlation Tracker gives you a clear view of how closely Bitcoin is moving with major growth stocks. The Liquidity Phase Overlay shows whether the current environment is generous or harsh for high beta risk assets. The Macro Audio Brief distills complex macro moves into short, digestible updates. Signal Replay Videos transform past liquidity shifts into educational lessons that sharpen your intuition.
Together, these tools turn macro from an abstract concept into a practical daily resource. They help you transform noise into signal, align your trading decisions with the broader tides of the market, and treat crypto as the macro sensitive asset it has become. Whether you are a short term trader or a longer term investor, viewing crypto through a macro lens gives you a deeper, more resilient understanding of what is really driving price action across each phase of the cycle.
Whether you’re a seasoned investor or just starting out, our financial astrology tools can be tailored to your specific investment goals. Gain valuable insights to achieve your financial aspirations.
Address
1301, 13th Floor, Skye Corporate Park, Near Satya Sai Square, AB Road, Indore 452010
+91 9669919000
© All Rights Reserved by RajeevPrakash.com (Managed by AstroQ AI Private Limited) – 2025