The Relative Strength Index (RSI) is a popular momentum oscillator used by traders to identify overbought or oversold conditions in the market. When applied to 15-minute charts, selecting the best RSI settings is crucial for making timely and accurate trading decisions. This article will explore the optimal RSI settings for 15-minute charts, helping you enhance your day trading strategy and improve your market analysis.
Understanding RSI and Its Settings
The RSI is a momentum oscillator that measures the speed and change of price movements. It ranges from 0 to 100 and is typically used to identify potential reversal points. The standard RSI settings are a 14-period lookback, but these settings may not always be ideal for shorter time frames like the 15-minute chart.
Why Adjust RSI Settings for 15-Minute Charts?
On shorter time frames, such as the 15-minute chart, market movements can be more volatile and rapid. The default RSI settings might produce signals that are too slow or too frequent for effective trading. Adjusting the RSI settings helps to tailor the indicator to the specific characteristics of the 15-minute time frame, improving its ability to generate actionable signals.
15-Minute RSI Settings Optimizer Calculator
A quick, practical tool to generate RSI length and level settings for 15-minute charts based on your style, asset behavior, and market noise.
Choose your context
Tell the calculator how you trade and what you trade.
Get tuned settings
Receive RSI length plus overbought and oversold levels.
Apply with a rule
Use the one-paragraph playbook and adjust if needed.
Tip for 15-minute charts
Faster RSI lengths create more signals but also more noise. In choppy conditions, the best improvement is usually a slightly longer RSI and wider levels.
Inputs
Optimized Output
RSI Length
—
Overbought
—
Oversold
—
15-Minute Playbook
Click Optimize to generate a playbook based on your selections.
If it feels too fast or too slow
—
Disclaimer: Educational tool only. Always backtest and apply position sizing and stops.
Optimal RSI Settings for 15-Minute Charts
- Shorter Lookback Period (7-10 Periods):
- Description: Reducing the lookback period from the standard 14 to 7 or 10 periods makes the RSI more sensitive to recent price changes.
- Benefits: This adjustment can provide more timely signals and better capture short-term price movements, making it suitable for the fast-paced nature of 15-minute charts.
- How to Set: In your trading platform, adjust the RSI period from 14 to 7 or 10 to fit the 15-minute chart.
- Higher Overbought/Oversold Levels (70/30):
- Description: The standard RSI levels are 70 (overbought) and 30 (oversold). On a 15-minute chart, you might want to use higher levels such as 80 and 20 to filter out noise.
- Benefits: This setting helps to avoid false signals and reduces the number of trades based on temporary price fluctuations.
- How to Set: Change the overbought level to 80 and the oversold level to 20 in your RSI settings.
- Combination of Short and Longer Periods (7 and 14 Periods):
- Description: Using a combination of shorter and standard periods (e.g., RSI with 7 periods and 14 periods) can provide a balanced view of both short-term and longer-term momentum.
- Benefits: This approach helps to cross-check signals and improve the accuracy of trading decisions by comparing different time horizons.
- How to Set: Add both RSI indicators to your chart with 7-period and 14-period settings to analyze their signals together.
How to Implement RSI Settings in Your Trading Strategy
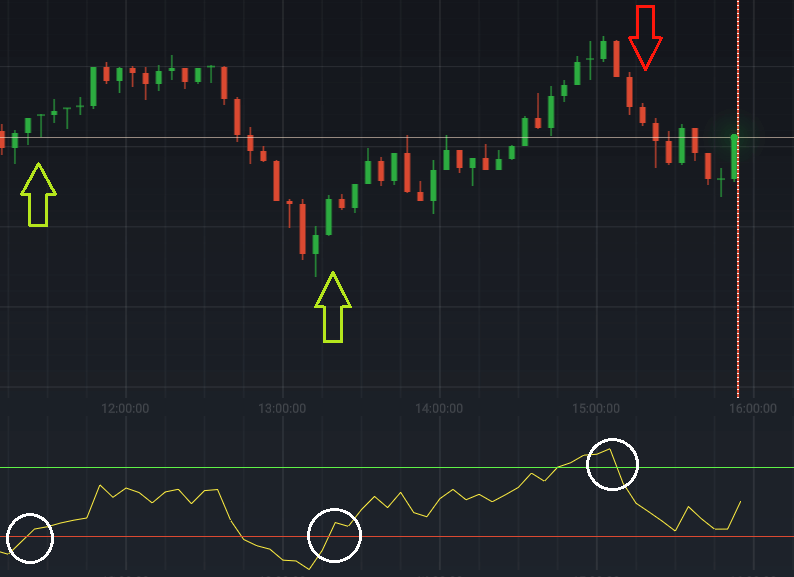
- Look for Divergence:
- Description: Use the adjusted RSI settings to spot bullish or bearish divergence. When the price makes new highs or lows that are not confirmed by the RSI, it can signal potential reversals.
- How to Use: Monitor the RSI for divergences from price action to identify potential entry and exit points.
- Combine with Other Indicators:
- Description: Enhance the effectiveness of your RSI settings by combining them with other technical indicators, such as moving averages or trendlines.
- How to Use: Use complementary indicators to confirm RSI signals and improve the reliability of your trades.
- Set Alerts and Monitor Trends:
- Description: Set alerts based on your RSI settings to be notified of key overbought or oversold conditions.
- How to Use: Configure your trading platform to alert you when the RSI crosses critical levels, helping you stay informed and react quickly to market changes.
Common Mistakes to Avoid
- Over-reliance on RSI Alone:
- Description: Relying solely on RSI settings can lead to missed opportunities or false signals.
- How to Avoid: Use RSI in conjunction with other technical analysis tools to validate signals and improve trading accuracy.
- Ignoring Market Conditions:
- Description: Market conditions and volatility can affect the performance of RSI settings.
- How to Avoid: Always consider the broader market context and adjust your RSI settings accordingly.
- Setting Too Short a Period:
- Description: Using excessively short periods for RSI can result in too many signals and increased noise.
- How to Avoid: Find a balance between sensitivity and reliability by testing different RSI periods and evaluating their performance.
Conclusion
Finding the best RSI settings for 15-minute charts involves adjusting the lookback period and overbought/oversold levels to better match the dynamics of short-term trading. By experimenting with shorter periods, and higher levels, and combining different RSI settings, you can enhance your trading strategy and make more accurate decisions. Remember to combine RSI with other indicators and consider overall market conditions to improve the effectiveness of your trading approach.
