Your cart is currently empty!
Best Indicators for Day Trading SPY
Day trading SPY (the SPDR S&P 500 ETF Trust) can be an exhilarating and profitable venture. However, to navigate the fast-paced market successfully, day traders need to utilize effective tools and strategies. Below are some of the best indicators for day trading SPY, complete with practical applications and examples.
1. Moving Averages
Simple Moving Average (SMA)
Definition: The SMA calculates the average price of SPY over a specified period, smoothing out price fluctuations.
Usage: Traders often look for crossovers between different SMAs to identify potential trend changes. For example, a trader may buy SPY when the 50-day SMA crosses above the 200-day SMA (known as a “golden cross”) and sell when it crosses below (a “death cross”).
Exponential Moving Average (EMA)
Definition: The EMA places greater weight on the most recent prices, making it more sensitive to price changes than the SMA.
Usage: In day trading, traders might employ a 9-day EMA and a 21-day EMA. If the 9-day EMA crosses above the 21-day EMA, it may indicate a buying opportunity. Conversely, a crossover below could signal a sell.
Example:
Let’s say SPY has recently traded below its 50-day SMA. If it moves above this level, it could signal a bullish reversal, prompting a day trader to enter a long position.
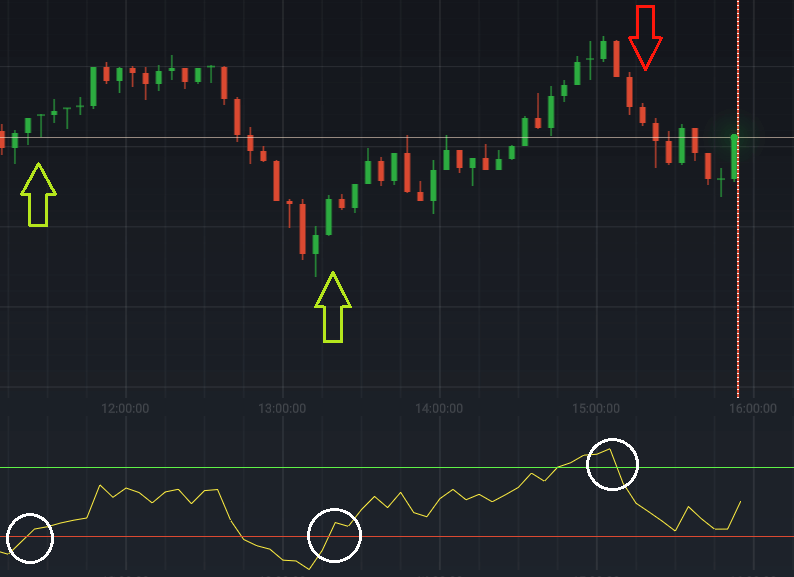
2. Relative Strength Index (RSI)
Definition: The RSI is a momentum oscillator that ranges from 0 to 100, indicating whether an asset is overbought or oversold.
Usage: Day traders often look for divergences between the RSI and SPY’s price movement. For instance, if the SPY is making new highs but the RSI is falling, this could indicate a weakening trend and a potential reversal.
Example:
An RSI reading above 70 could trigger a sell alert, while a reading below 30 might suggest a buying opportunity.
3. Bollinger Bands
Definition: Bollinger Bands consist of a middle band (SMA) and two outer bands that are standard deviations away from the SMA.
Usage: The contraction and expansion of the bands indicate market volatility. A price breakout above the upper band can be seen as a bullish signal, while a breakout below the lower band may indicate a bearish sentiment.
Example:
If SPY is trading near the upper band and the bands are expanding, a day trader might consider taking profits or entering a short position.
4. Volume
Definition: Volume measures the number of shares traded during a specified time frame.
Usage: High trading volume can confirm price movements. For example, if SPY breaks a significant resistance level on high volume, it may indicate a stronger conviction behind the move.
Example:
A spike in volume during an upward price movement can validate a breakout, while a decline in volume during a price rise may signal a potential reversal.
5. Average True Range (ATR)
Definition: ATR measures market volatility by analyzing the average range of price movement over a specific period.
Usage: Day traders can use ATR to set appropriate stop-loss orders based on current volatility levels. A higher ATR suggests a wider stop-loss distance, while a lower ATR allows for tighter stops.
Example:
If the ATR for SPY is 1.50, a trader might set their stop-loss 1.50 points below their entry point to accommodate normal price fluctuations.
6. MACD (Moving Average Convergence Divergence)
Definition: The MACD is a trend-following momentum indicator that shows the relationship between two EMAs (usually 12-day and 26-day).
Usage: Traders look for MACD line crossovers with the signal line, along with histogram analysis to assess momentum. A bullish crossover indicates potential upward momentum, while a bearish crossover suggests downward pressure.
Example:
If the MACD line crosses above the signal line and both lines are below zero, it may indicate a bullish reversal in a downtrend, signaling a buy opportunity.
7. Stochastic Oscillator
Definition: The stochastic oscillator compares SPY’s closing price to its price range over a specific period, helping identify overbought or oversold conditions.
Usage: A stochastic reading above 80 indicates overbought conditions, while a reading below 20 indicates oversold conditions. Traders often look for crossovers in the stochastic lines as additional confirmation for entry and exit points.
Example:
If SPY is trading above the upper band of the stochastic oscillator while moving lower, a trader might consider this a signal to exit a long position.
8. Fibonacci Retracement Levels
Definition: Fibonacci retracement levels indicate potential support and resistance based on the Fibonacci sequence.
Usage: Day traders often use these levels after a significant price movement. If SPY retraces to a key Fibonacci level, it could present a potential entry point for a continuation of the trend.
Example:
If SPY experiences a sharp rally and then retraces to the 61.8% Fibonacci level, traders might look for a confirmation signal to enter a long position in anticipation of a rebound.
9. VWAP (Volume Weighted Average Price)
Definition: VWAP is the average price of SPY weighted by volume, providing an average price that considers both price and volume.
Usage: Many day traders use VWAP as a dynamic support and resistance level. Buying above VWAP and selling below it can help traders assess market trends.
Example:
If SPY is trading above its VWAP during the day, it may suggest bullish sentiment, while trading below VWAP can indicate bearish pressure.
Conclusion
Effectively using a combination of these indicators can significantly enhance a trader’s decision-making process when day trading SPY. It’s essential to adapt your strategy based on market conditions, volatility, and personal trading style.
Tips for Using Indicators in Day Trading SPY:
Combine Indicators: Use multiple indicators for confirmation. For instance, if the RSI indicates overbought conditions while MACD signals a bearish crossover, consider this a stronger signal to exit a long position.
Adapt to Market Conditions: Be flexible with your strategies; what works in a trending market may not work in a range-bound environment.
Practice Risk Management: Always implement stop-loss orders and manage your position sizes to minimize risk.
By mastering these indicators and their applications, traders can effectively navigate the day trading landscape of SPY, increasing their chances of success and profitability.
Ready to elevate your trading game? Join our community of expert traders for exclusive insights, daily newsletters, and live trading signals delivered straight to your WhatsApp. Don’t miss out on the opportunity to enhance your skills and strategies!

Mr. Rajeev Prakash
Rajeev is a well-known astrologer based in central India who has a deep understanding of both personal and mundane astrology. His team has been closely monitoring the movements of various global financial markets, including equities, precious metals, currency pairs, yields, and treasury bonds.