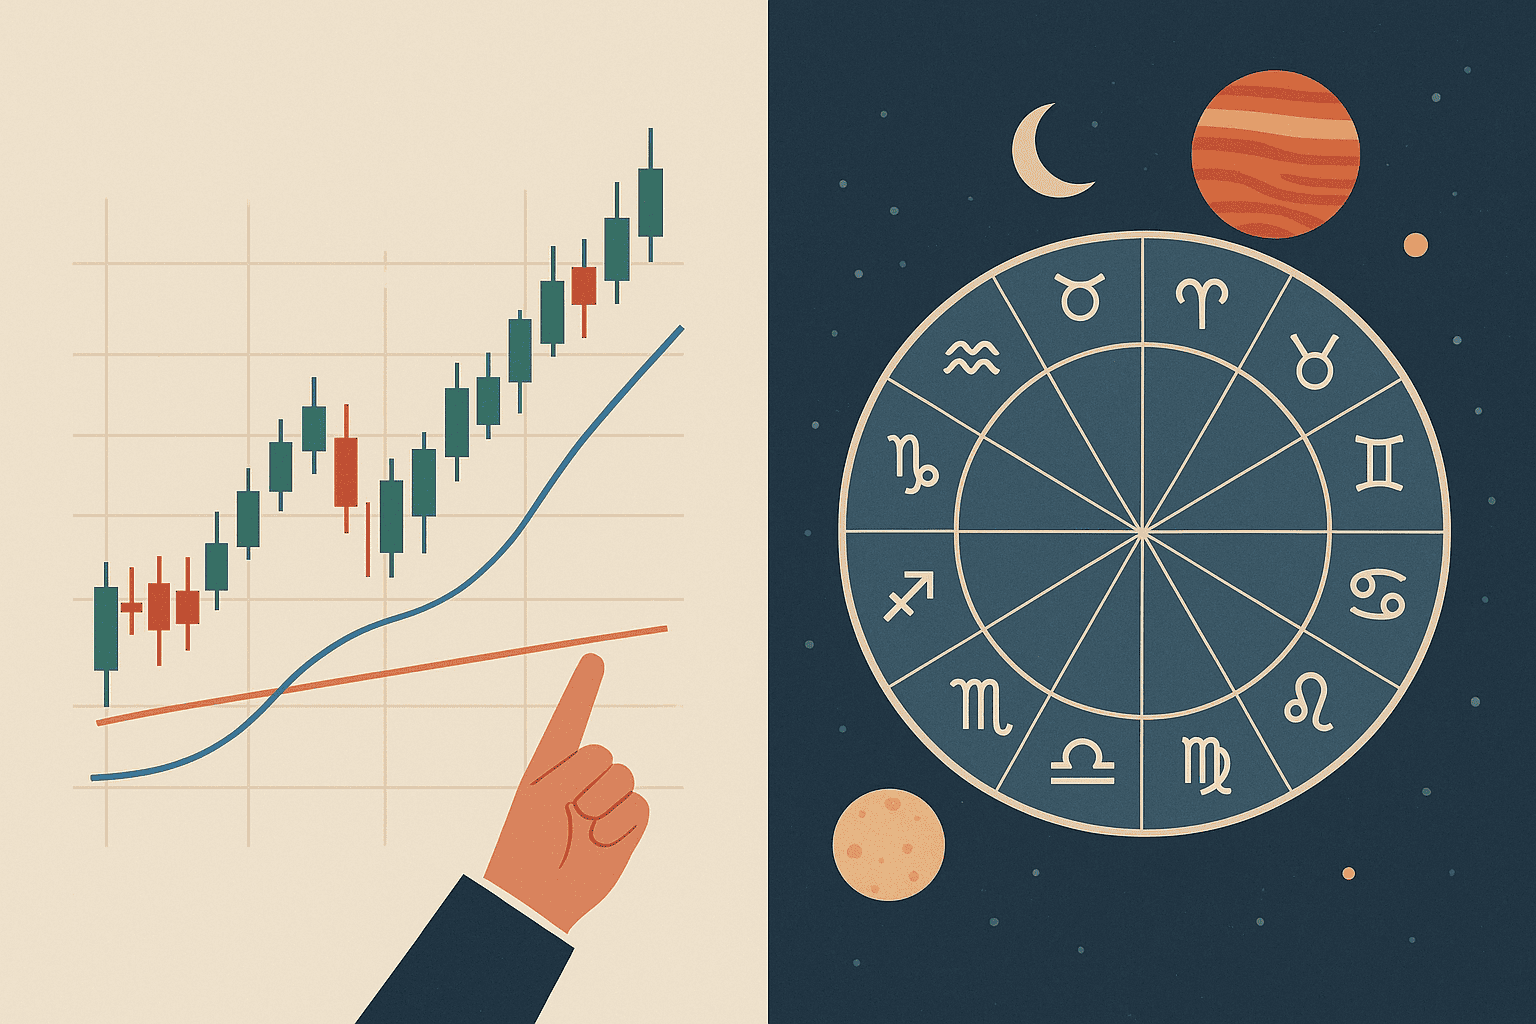
Why Astro Trading Strategy Is Back In Focus For US Stocks
Astro trading strategy has quietly moved from the fringes of market lore to the watchlists of serious traders who work with US stocks every single day. In a world where algorithms react in milliseconds and macro headlines change sentiment overnight, many traders are hungry for a bigger framework that explains why certain days, weeks, or months feel more volatile, irrational, or surprisingly smooth. This is where financial astrology trading steps in.
Rather than replacing charts and data, an astro trading strategy for US stocks is designed to add a timing layer. It looks at planetary cycles, transits, and aspects to identify windows of heightened probability. When that timing layer is combined with simple, robust price action, traders can often see the market with more context. The same breakout pattern on the S&P 500 or a US tech leader like Apple, Nvidia, or Microsoft may behave very differently under calm transits compared to periods of intense celestial pressure.
In practice, astro trading US stocks is not about superstition. It is about pattern recognition across cycles. Just as traders accept seasonality, business cycles, and central bank policy cycles, astro traders accept that human behavior, risk appetite, and crowd psychology also respond to energetic cycles reflected symbolically in planetary motion. An astrology trading strategy is simply another structured way to map these cycles into actionable trade plans.
In this long form guide, you will walk through the building blocks of a practical US stock astro timing framework, understand the role of each major planet, see how to blend transits with chart patterns, and learn how to create your own repeatable astro trading strategy for blue chip stocks and leading US tech names. The goal is not blind faith in the stars, but intelligent integration of financial astrology trading with the same discipline you already apply to support resistance, moving averages, and risk management.
Understanding The Foundations Of Financial Astrology Trading
An effective astro trading strategy begins with clarity on what financial astrology is actually trying to do. At its core, financial astrology trading focuses on timing. It does not claim to predict every tick of the S&P 500 or every intraday spike in a tech stock. Instead, it aims to highlight periods when probabilities are skewed, when emotions are likely to be elevated, or when trend continuation or reversal becomes more likely.
The building blocks of this approach are planetary cycles and planetary transits. A planet’s cycle is the time it takes to complete one orbit relative to the zodiac. Shorter cycles like the Moon, Mercury, and Venus are useful for short term swings, gaps, and sentiment driven moves. Longer cycles like Jupiter and Saturn are used to understand multi month and multi year phases in US equities. Uranus, Neptune, and Pluto are associated with deep structural shifts, regime changes, and themes such as technology disruption, bubbles, and crises.
A transit is simply the current position of a planet compared to a reference point. That reference point might be the inception chart of a major index like the S&P 500, the incorporation chart of a specific US company, or a broader national or financial chart. When you talk about an astrology trading strategy in practice, you are usually looking at transits to these key charts, asking where stress, expansion, or turning points may arise.
What makes astro trading US stocks interesting is that the same transits often correlate with recurring patterns in price. Markets do not move only because of astrology. They move because investors respond to news, policy, earnings, and liquidity. But if human response clusters around certain cyclical windows, those windows become useful for a trader who wants to be positioned a bit earlier, or who wants an extra filter before taking risk.
Planetary Cycles Most Relevant To US Stock Astro Timing
A practical astrology trading strategy does not need every single aspect and minor configuration. It focuses on the main planetary cycles that tend to show clear correlation with market mood.
The Moon represents sentiment, flows, and very short term mood. Its cycle of roughly twenty nine and a half days often lines up with mini waves inside a trend. New Moons and Full Moons are watched for exhaustion or acceleration, especially when they align with important price levels on major indices like the S&P 500 or Nasdaq.
Mercury represents information, communication, trading, and execution. When Mercury is strong and moving direct, markets often respond smoothly to data and news. During Mercury retrograde phases, there is a higher frequency of false breaks, whipsaws, and confusing reactions. An astro trading strategy for US stocks often adjusts position sizing or holds off on aggressive new positions right at the start of a Mercury retrograde, especially if it hits sensitive degrees in key charts.
Venus is associated with value, money, and attraction. Its transits can highlight phases where investors show renewed appetite for quality blue chips, consumer names, or sectors tied to comfort and lifestyle. Venus retrogrades, though less frequent, can mark re evaluation of valuations and shifting preferences between growth and value.
Mars carries themes of aggression, speed, and conflict. When Mars activates critical points in the chart of a major stock index or a mega cap leader, price action can become sharp and emotional. Breakouts may overshoot, and pullbacks can be violent. Many financial astrology trading approaches pay special attention when Mars forms tense aspects to Saturn, Uranus, or Pluto, since these can sync with spikes in volatility and sudden trend changes.
Jupiter represents expansion, optimism, and growth. Its roughly twelve year cycle is tightly linked to broad bull and bear phases in US stocks. When Jupiter supports key points in an index chart, liquidity and risk appetite tend to return more easily. When Jupiter is stressed, hope fading or over optimism being corrected are common themes.
Saturn is the planet of structure, reality, and accountability. Its transits often correspond with tests of support, regulatory changes, and the need for companies and markets to prove they deserve their valuations. When Saturn challenges major US stock indices, markets often confront the limits of prior exuberance.
Uranus relates to innovation, shocks, and disruption. Its long transits through signs associated with finance and technology have tended to coincide with waves of transformation. This is especially relevant for an astro trading strategy focused on US tech leaders, where Uranus symbolism is very strong. Sudden gaps, surprise news, and extreme moves often appear under strong Uranian aspects.
Neptune and Pluto work more quietly yet deeply. Neptune is linked to liquidity, leverage, and illusions, while Pluto governs power, debt, crises, and regeneration. Their aspects to key points in market charts frequently align with bubbles, credit expansions, and subsequent de leveragings.
All of these themes are not predictions on their own. They become part of a working astrology trading strategy only when integrated with the charts and price action of the instruments you actually trade.
Building A Practical Astro Trading Framework For US Blue Chips
To create a reliable astro trading strategy for US stocks, you need a framework that you can repeat across time. The first step is to define your instruments. Many traders choose a small universe of US blue chips and tech leaders, such as the S&P 500 index, the Nasdaq 100, and a basket of heavyweights from sectors like technology, financials, and consumer discretionary.
Once your universe is clear, the next step is to gather the relevant charts. This often includes the inception chart of the index, the incorporation chart of individual companies where available, and sometimes a national chart, such as the USA chart used by many financial astrologers. Your goal is not to get lost in charts, but to identify a handful of sensitive degrees and planetary positions that the market has responded to repeatedly.
From there, you map current transits. That means tracking where the Sun, Moon, Mercury, Venus, Mars, Jupiter, Saturn, and outer planets are today, tomorrow, and in the coming weeks. You highlight the days when key transits form exact aspects to your sensitive points. These dates become your astro timing windows. Some windows will be associated with elevated risk of reversal. Others will be more supportive of trend continuation or acceleration.
This is where the price action layer enters. On your daily and intraday charts for US stocks or indices, you mark obvious support and resistance, recent swing highs and lows, gaps, and key moving averages. Then you overlay your timing windows. When a significant planetary transit aligns with a technical level, your attention intensifies. That is where an astro trading strategy finds its edge. Price is telling you that many eyes already respect that level. Astrology suggests that emotional energy and participation may peak around that time.
You do not trade every transit. Instead, you let the market show its hand. If, near a major transit date, the S&P 500 tests a multi week support and prints a clear reversal pattern on strong volume, that may be a high quality long setup within your astro trading strategy. If a leading US tech stock is pressing into all time highs under a stressed transit, you may wait for confirmation or reduce aggressive risk, expecting heightened volatility and potential shakeouts.
The key idea is that your astro trading US stocks framework must stay grounded in real charts and risk control. Astrology provides time and context. Technical levels define structure. Your strategy lives at the intersection of both.
Using Lunations And Eclipses As Short Term Timing Tools
Among all celestial events, lunations New Moons and Full Moons and eclipses attract the most attention in financial astrology trading. For US stocks, these events often cluster around emotional peaks or troughs, especially when they occur near important price pivots or within sensitive degrees of the index chart.
New Moons tend to mark seeding points. They can correspond with the early phases of a move or with subtle shifts in trend that only become obvious days later. When a New Moon occurs close to support in the S&P 500 or in a large cap stock that has corrected, many astro traders look for signs of accumulation and recovery.
Full Moons, especially when they are linked to strong aspects, are associated with heightened emotion and completion. In an uptrend, they can align with temporary exhaustion and short term pullbacks. In a downtrend, they may mark capitulation or climactic reversals. It is never automatic, but the pattern recurs often enough that an astrology trading strategy assigns weight to these dates.
Eclipses are New or Full Moons amplified. They often coincide with events that have broader impact, such as policy changes, major corporate announcements, or macro shocks. Because their influence stretches over weeks or months, astro trading strategy for US stocks uses eclipse periods as markers of broader regime shifts or acceleration in existing themes. A solar eclipse that lands on a sensitive point in the chart of a major index or in an important US tech leader can precede powerful moves.
The practical way to use these tools is simple. Place vertical time markers on your charts for each New Moon, Full Moon, and eclipse season. Study how US stocks behave around these points. Over time, you will build your own evidence. You may notice that certain sectors or specific stocks react more sharply. That observation is then folded into your broader financial astrology trading plan.
Mercury Retrograde And Trading Execution In US Markets
No discussion of astro trading US stocks is complete without Mercury retrograde. While the term is popular in mainstream culture, traders have a much more practical concern. Mercury is associated with communication, data, trading, and technology. In markets dominated by electronic platforms, news feeds, and algorithmic order routing, that symbolism is highly relevant.
During Mercury retrograde periods, markets often see more headlines, revisions, and short lived swings. Announcements may be delayed or clarified. Initial reactions to news can be exaggerated, then faded. Technical breakouts may fail more frequently, and stop losses can be triggered by sudden spikes that resolve quickly. None of this makes trading impossible, but it changes the character of price action.
An astrology trading strategy that respects Mercury retrograde phases usually adjusts in a few ways. Position sizing may be reduced, especially at the start of the retrograde. Trades that depend heavily on overnight gaps or clean trend continuation are treated more cautiously. Execution risk is reviewed, with greater emphasis on checking platform connectivity, data feeds, and order parameters.
It is also common to see market participants revisiting previous themes or levels during Mercury retrograde. That fits the symbolism of review and reconsideration. For US stocks, this can mean that prior support or resistance zones are retested. For example, a US tech leader that recently broke out may pull back to its breakout level in a retrograde phase, offering a second chance entry for patient astro trading strategy practitioners.
The main point is not fear. It is awareness. Knowing that the probability of noise and mixed signals is higher under Mercury retrograde can prevent overconfidence. That awareness, combined with disciplined technical reading, helps you avoid emotional overreaction to every sudden tick.
Jupiter, Saturn, And The Bigger Picture For US Stock Trends
Short term trading can be exciting, but financial astrology trading really shines when it is applied to larger cycles. For US stocks, Jupiter and Saturn are central in this respect. Their transits and mutual aspects often frame multi year bull and bear phases, as well as important inflection points within those phases.
Jupiter’s role as the planet of growth and expansion makes its movement through signs and its aspects to key index positions especially relevant. When Jupiter supports the natal positions of major indices or the US chart, liquidity and optimism tend to resurface more easily, even after corrections. You may notice that rallies gain traction more quickly and that dips are bought with confidence.
Saturn, by contrast, demands proof. Its transits often arrive when valuations must justify themselves, when leverage and over reach are called into question. Tightening monetary policy, stricter regulations, or a shift in investor preference toward quality over speculation have a Saturn signature.
The dance between Jupiter and Saturn is therefore fundamental to any astrology trading strategy that looks beyond short term swings. When Jupiter is strong and Saturn is relatively supportive, broad uptrends in US stocks have an easier time continuing. When Saturn forms challenging aspects and Jupiter’s support weakens, the market is more vulnerable to drawdowns, sideways consolidations, or topping patterns.
Astro trading US stocks at this level often involves mapping out the key Jupiter and Saturn aspects on a multi year chart of indices such as the S&P 500 and Nasdaq, then comparing these with major highs and lows. Over decades, certain correlations emerge. This does not mean that every aspect will produce a major top or bottom. It does mean that traders can anticipate periods where trend strength will be tested, liquidity may contract, and risk appetite may change in character.
For a trader who already uses macro indicators and central bank watching, this planetary cycle perspective becomes another macro lens, helping to avoid complacency near euphoric highs and panic near deeply oversold lows.
Uranus, Innovation, And US Tech Leaders
If there is one planet that matches the spirit of US technology stocks, it is Uranus. The symbolism of Uranus includes innovation, disruption, sudden change, and breaking from tradition. These are exactly the themes that dominate periods of rapid tech advances, shifting business models, and unexpected market winners and losers.
An astro trading strategy that focuses on US tech stocks pays close attention to Uranus transits. These transits can align with breakthrough products, regulatory surprises, sharp re ratings of valuations, or sudden crashes when over extended narratives are questioned. Because tech leaders often carry a large weight in indices like the Nasdaq and S&P 500, Uranus activity can also ripple through the broader market.
From a practical trading perspective, Uranus periods often bring large gaps, unexpected intraday ranges, and violent squeezes or collapses. Position management and risk control are therefore even more important. Financial astrology trading does not encourage reckless speculation under Uranus transits. Instead, it suggests respecting the heightened potential for surprise. This can support strategies such as taking partial profits into euphoric spikes, tightening stops after extended runs, or waiting for clear confirmation rather than anticipating every breakout.
Beyond the immediate price action, Uranus also marks themes that can define entire multi year market narratives. Its movement through signs associated with money and value has coincided in the past with major shifts in how markets treat technology, digital infrastructure, and new asset classes. For traders grounded in price action, watching Uranus can help anticipate when a long running theme may be maturing or when a new wave of opportunity may be forming.
Translating Planetary Signals Into Price Action Setups
Up to this point, you have seen how different planets and cycles relate to market behavior. The real power of an astro trading strategy appears when you translate these signals into specific, repeatable price action setups.
The process starts with a calendar. You mark key transit dates, lunations, eclipses, and significant aspects involving planets like Jupiter, Saturn, and Uranus. For each date, you note which indices or blue chip stocks are most affected based on their charts. This gives you a forward looking list of time windows when you expect elevated significance.
Next, you track price as you normally would. You identify clear support and resistance, trend lines, moving averages, and recent consolidation zones on the daily chart. On intraday charts, you monitor how price behaves as it approaches your astro timing windows. You are particularly interested in confluence — situations where a strong transit date overlaps with a retest of a multi week level, a test of a moving average, or a breakout from a well defined pattern.
For example, suppose you know that a Full Moon is approaching that activates a sensitive point in the S&P 500 chart. If price has been grinding upward into that date and is now testing a clear horizontal resistance, you pay closer attention. If on the day of or just after the Full Moon, you see a reversal candle with strong volume at that resistance, your astro trading strategy may treat that as a higher probability short term reversal setup.
Conversely, if a New Moon or supportive Jupiter transit is lining up with a retest of broken resistance acting as support in a major US tech leader, you may look for bullish price action patterns to enter or add to a long position, with clear stops below the level.
The important part is discipline. You do not trade just because there is a transit. You trade when the transit and the chart speak the same language. Astrology provides the timing and psychological backdrop. Price action provides the objective evidence that market participants are actually reacting in a way that fits the story.
Risk Management Within An Astro Trading Strategy
No matter how elegant an astrology trading strategy appears, it cannot bypass the reality of risk. US stocks can gap on earnings, news, or macro surprises that have nothing to do with the transits you are watching. For this reason, your astro trading US stocks framework must embed conservative risk management from the start.
Position sizing should always reflect volatility. If you expect higher volatility around an eclipse or a heavy Uranus transit, you can either reduce your lot size or widen your stops while keeping total risk per trade constant. If Mercury is retrograde and you know whipsaws are more common, you may choose to be highly selective, focusing only on the clearest confluence setups.
Stops and exit rules should be defined in terms of price action, not purely astrology. A supportive transit does not guarantee that support will hold. If price breaks your level decisively, the market is telling you that your thesis was wrong or early. Respect that information. Financial astrology trading is most effective when it is humble about its limitations and treats every signal as probabilistic, never absolute.
Diversification also plays a role. Rather than concentrating all risk into a single stock because a transit looks dramatic, many astro traders prefer to spread exposure across indices and a few leaders, or across time by scaling in and out around key dates instead of going all in at one moment.
Finally, journaling is crucial. Every time you act on your astro trading strategy, record the planetary context, the technical setup, the entry and exit, and the result. Over months and years, this builds a personal database of evidence. You will see which types of transits align best with your style and which are too noisy or unreliable. That feedback loop is what turns financial astrology trading from theory into a refined, realistic edge.
Backtesting And Evaluating Your US Stock Astro Trading Strategy
To gain confidence in astro trading US stocks, you need more than intuition. You need data. Even if you do not code complex backtests, you can still create a methodical evaluation process.
Begin by choosing a historical window for one or two major US indices and a handful of liquid blue chips or tech leaders. Gather the key transit dates you are interested in, such as New Moons, Full Moons, eclipses, and significant Jupiter, Saturn, or Uranus aspects. Mark these dates on historical price charts.
Then, review how the market behaved around them. Did reversals cluster near certain types of transits more often than chance would suggest. Did breakouts near supportive transits have higher follow through. Did retrograde periods show more failed signals.
Keep your criteria objective. Define in advance what you would consider a successful signal versus a non event. For instance, you may decide that a reversal is valid if price changes direction and moves at least a certain percentage within a fixed number of days after the transit. By tallying how many times those conditions were met, you turn a qualitative impression into a measurable pattern.
Over time, this exercise reveals that some transits are consistently more useful for your astro trading strategy, while others add noise. You may discover that your approach performs best when combining only a few planetary factors with clear technical rules, instead of trying to interpret every aspect in the sky.
This process also guards against hindsight bias. It is easy to cherry pick dramatic examples where a transit coincided with a big move and ignore all the times when nothing special happened. Structured backtesting forces you to confront the full distribution of outcomes and to build your astrology trading strategy around genuinely robust tendencies rather than isolated anecdotes.
Integrating Astro Trading With Your Existing Technical Toolkit
If you already use standard tools like trend lines, moving averages, oscillators, and volume analysis, you do not need to abandon any of them. Astro trading strategy is most powerful when it acts as a complementary filter, not a replacement.
For example, you might normally trade breakouts in leading US stocks when price closes above a clear resistance with strong volume. By adding astro trading US stocks to your process, you can refine the timing of those breakouts. You might be more willing to hold through volatility if a breakout aligns with supportive transits, or more inclined to take partial profits into a stressful transit window.
Similarly, your risk management rules, such as maximum portfolio exposure, per trade risk limits, and daily loss limits, continue unchanged. Astrology does not override your risk tolerance. It simply informs where you expect faster movement or choppy conditions so you can adjust within your existing framework.
You can also integrate astro trading signals into higher time frame analysis. If your macro view suggests that US stocks are late in a cycle based on valuations and economic indicators, and you see Saturn or Pluto aspects adding pressure to key market charts, you may choose to reduce long term exposure or focus on more defensive trades. If Jupiter cycles appear supportive and earnings trends are healthy, you may maintain a more optimistic stance during pullbacks.
In short, an astrology trading strategy becomes one more lens among many, helping you see the market’s rhythm more clearly while still respecting the rational tools that every disciplined trader relies on.
The Mindset Required For Successful Financial Astrology Trading
Beyond techniques and cycles, astro trading US stocks demands a specific mindset. It requires curiosity and openness to symbolic systems, but it also demands skepticism and discipline. You must be willing to explore planetary correlations without becoming dogmatic. You must respect the craft of astrology without letting it become an excuse to ignore what price is actually doing.
Emotional balance is crucial. Planetary transits can sound dramatic, and when you read descriptions involving words like crisis, shock, or transformation, it is easy to become anxious or overly excited. A mature astrology trading strategy treats these descriptions as metaphors pointing to periods of heightened possibility, not guaranteed catastrophe or guaranteed profit.
Patience is another key trait. Many of the most meaningful transits unfold over weeks or months. Their influence may be subtle at first, only becoming obvious in hindsight. You cannot force the market to react on your preferred schedule. Instead, you wait for the chart to confirm that the energy you anticipated is being expressed through price.
Finally, humility ties everything together. Financial astrology trading can reveal striking patterns, but it does not remove uncertainty. The best astro traders know that they will still be wrong many times. Their goal is not perfection. It is to tilt the odds slightly in their favor by being better aligned with the market’s emotional and cyclical currents, while always using robust risk control.
Crafting Your Own Astro Trading Strategy For US Stocks
By now, you have a broad map of how an astro trading strategy for US stocks can work. The final step is to shape this map into a personal approach that fits your time frame, risk tolerance, and preferred instruments.
You might decide to focus primarily on major US indices, using astro timing to refine swing trades that last days to weeks. In that case, your emphasis will be on lunations, eclipses, and the larger outer planet aspects that affect index level sentiment.
Or you may be drawn to US tech leaders and growth stocks, where Uranus and Jupiter transits are particularly expressive. Your astrology trading strategy might center on identifying windows when these stocks are more likely to experience breakout moves or sharp corrections, then combining that timing with classic chart patterns.
Whatever path you choose, keep it simple at first. Select a small number of planetary factors to track. Combine them with clear, mechanical technical rules. Trade small while you gain experience. Document everything. Over time, you will naturally refine your process, dropping what is not helpful and doubling down on the combinations that consistently add clarity.
Astro trading strategy is not magic, yet it can feel almost uncanny when you see how often markets express the rhythms of planetary cycles in their own language of price and volume. For traders in US stocks who want a deeper understanding of why certain periods feel so different from others, financial astrology trading offers a structured, time tested way to connect the sky’s cycles with Wall Street’s charts.
When you blend planetary transits with price action thoughtfully, you are no longer reacting blindly to every headline. Instead, you are working with a broader context, positioning yourself ahead of key windows, and letting the market confirm or deny your hypotheses. That is the real edge of an astrology trading strategy grounded in discipline and respect for both the stars and the screen in front of you.
