Your cart is currently empty!
The Russell 2000 Forecast
The Russell 2000 Index is a key benchmark for small-cap stocks in the U.S. market. It includes 2,000 of the smallest companies in the Russell 3000 Index, offering a comprehensive view of the small-cap sector. This article explores the history of the Russell 2000, provides live trading signals, and offers forecasts for 2024, tomorrow, next week, the next 5 years, and the next 10 years.
The Russell 2000 Index, a key benchmark for small-cap stocks in the United States, provides a vital glimpse into the performance and trends of smaller, emerging companies. Tracking the index offers insights into the health and growth potential of small-cap stocks, which are often more volatile but can present significant opportunities for investors. This article explores the evolution of the Russell 2000 from its inception to its current status and projects its future trajectory.
Historical Background of the Russell 2000
The Creation and Early Years
The Russell 2000 Index was introduced in 1984 by the Frank Russell Company (now known as Russell Investments). Created as a complement to the Russell 1000 Index, which tracks the largest 1,000 companies in the U.S., the Russell 2000 was designed to represent the performance of the smallest 2,000 stocks within the Russell 3000 Index. This inclusion of smaller companies aimed to provide a more comprehensive view of the U.S. stock market and to serve as a benchmark for small-cap investments.
In its early years, the Russell 2000 faced several challenges, including a lack of widespread recognition and fluctuating performance metrics. However, as the index gained prominence, it became a crucial tool for assessing the health of smaller companies and understanding broader market trends.
Growth and Development in the 1990s
The 1990s marked a period of significant growth for the Russell 2000. The index benefited from a booming economy and a strong bull market that propelled many small-cap stocks to new highs. During this period, the Russell 2000 often outperformed the Russell 1000, reflecting the strong performance of smaller companies compared to their larger counterparts.
Key factors driving this growth included technological advancements, the rise of the internet, and an overall expansion of the U.S. economy. Small-cap companies, in particular, experienced robust growth as they capitalized on new opportunities and innovations.
The Dot-Com Bubble and Aftermath
The late 1990s and early 2000s witnessed the dot-com bubble, a period characterized by excessive speculation and investment in technology stocks. The Russell 2000 was significantly impacted by this phenomenon, as many of its constituents were technology and internet-based companies.
When the bubble burst in 2000, the Russell 2000 faced a sharp decline, mirroring the broader market’s troubles. However, the index showed resilience and gradually recovered as the economy adjusted and small-cap companies adapted to the post-bubble environment.
Live Russell 2000 Index
This section displays the advanced live chart of Russell 2000 Index Index from TradingView.
The Russell 2000 in the Present Day
Performance in the Post-Financial Crisis Era
Following the global financial crisis of 2008, the Russell 2000 rebounded strongly. The index benefited from a gradual economic recovery, increased consumer confidence, and low-interest rates, which fostered a favorable environment for small-cap stocks. The period saw substantial gains for the Russell 2000 as smaller companies led the charge in economic growth and innovation.
The recovery was also supported by favorable fiscal and monetary policies, including quantitative easing and stimulus packages, which bolstered investor sentiment and provided liquidity to the market.
Recent Trends and Market Dynamics
In recent years, the Russell 2000 has continued to demonstrate strong performance, albeit with some volatility. The index’s performance has been influenced by various factors, including:
Market Sentiment: Investor sentiment has played a crucial role in shaping the Russell 2000’s performance. Positive economic indicators and robust corporate earnings have supported the index’s growth, while uncertainties related to trade policies and geopolitical events have introduced periods of volatility.
Economic Policies: Changes in fiscal and monetary policies, such as tax reforms and interest rate adjustments, have impacted the performance of small-cap stocks. The 2017 tax reform, for instance, provided a significant boost to small-cap companies by reducing corporate tax rates.
Technological Innovation: Small-cap companies in sectors such as technology, healthcare, and renewable energy have experienced growth driven by innovation and increased demand for new products and services.
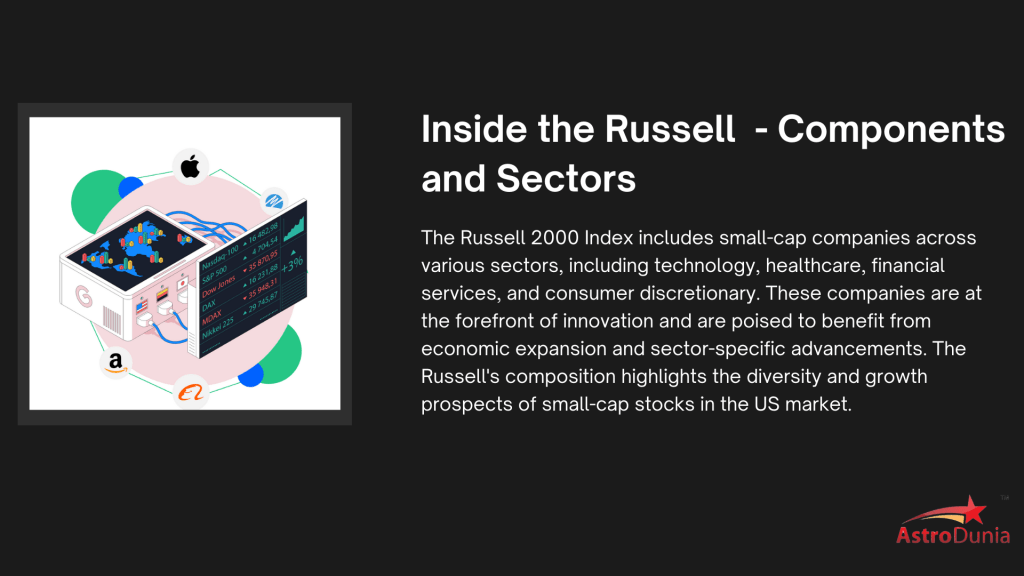
History of the Russell 2000
The Russell 2000 was introduced in 1984 by the Frank Russell Company. It was created to provide a better measure of the performance of smaller U.S. companies, which often have different growth characteristics and risks compared to larger companies.
Russell 2000 Forecast for 2024
Analysts predict steady growth for the Russell 2000 in 2024, driven by economic recovery and increased consumer spending. However, there may be intermediate phases of correction as detailed in the Annual Letter 2024. Key sectors to watch include healthcare, technology, and consumer discretionary. We offer live signals to help you make real-time informed decisions. Join now to stay ahead in the market.
Russell 2000 Forecast for Tomorrow
Daily forecasts for the Russell 2000 are influenced by market sentiment, economic data releases, and geopolitical events. Traders should monitor key indicators such as employment data, inflation rates, and corporate earnings reports. Get your daily dose of market insights and updates delivered straight to your inbox. Try our Daily Newsletter.
Russell 2000 Forecast for the Next 10 Years
Long-term projections for the Russell 2000 focus on macroeconomic trends and the growth potential of small-cap companies. Over the next decade, the index is expected to benefit from innovations in technology and healthcare, as well as shifts in consumer behavior. Want to stay long-term in the market? Join Annual Letter now to make informed decisions.
Russell 2000 Forecast for Today
Today’s forecast for the Russell 2000 involves analysing pre-market trends, global market performance, and key economic announcements. Investors should keep an eye on interest rate changes, inflation data, and major corporate news. We offer live signals to help you make real-time informed decisions. Join now to stay ahead in the market.
Russell 2000 Forecast for Next Week
Weekly forecasts combine technical analysis and macroeconomic factors. Key events such as Federal Reserve meetings and economic reports will significantly impact market movements. Get your daily dose of market insights and updates delivered straight to your inbox. Try our Daily Newsletter service.
Russell 2000 Technical Analysis Today
Technical analysis of the Russell 2000 involves examining chart patterns, RSI (Relative Strength Index), MACD (Moving Average Convergence Divergence), and support and resistance levels to identify potential trading opportunities. Join Live signals service for real time market insights.
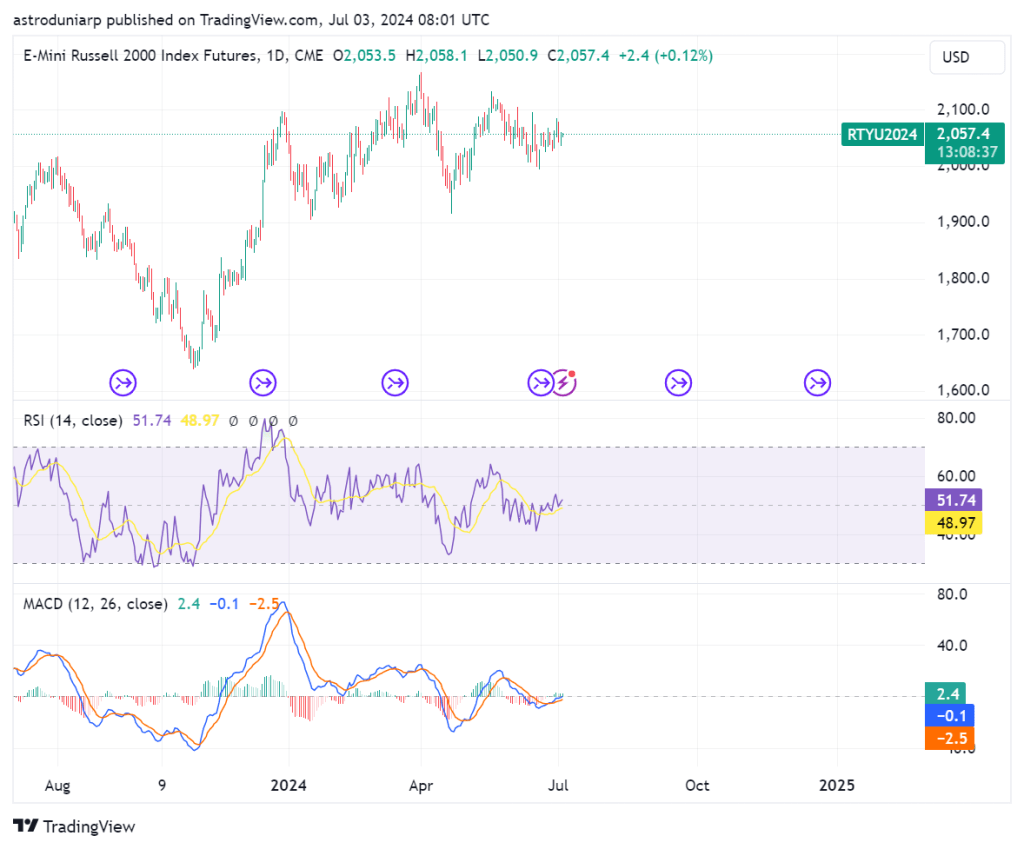
Chart displaying Russell index prices for last 1-Year
The Russell 2000: Looking Ahead
Forecasting Future Trends
As we look to the future, several factors are expected to influence the performance of the Russell 2000:
- Economic Growth: The continued expansion of the U.S. economy is likely to benefit small-cap companies, which often experience faster growth rates compared to their larger counterparts. Key economic indicators, such as GDP growth, employment rates, and consumer spending, will be crucial in determining the index’s future performance.
- Technological Advancements: Ongoing technological advancements and innovation are expected to drive growth in the small-cap sector. Companies involved in emerging technologies, such as artificial intelligence, biotechnology, and clean energy, are likely to play a significant role in shaping the future of the Russell 2000.
- Policy Changes: Future fiscal and monetary policies will impact small-cap stocks. For example, changes in interest rates, tax policies, and government regulations will influence the performance of small-cap companies and the broader market.
- Global Economic Conditions: Global economic conditions and trade relationships will also affect the Russell 2000. Economic slowdowns or uncertainties in international markets can impact small-cap companies, particularly those with global exposure.
Investment Strategies
Investors looking to capitalize on the Russell 2000’s potential should consider the following strategies:
- Diversification: Investing in a diverse range of small-cap stocks can help mitigate risks associated with individual companies. Diversification across different sectors and industries can enhance the potential for returns and reduce overall portfolio volatility.
- Focus on Innovation: Identifying companies that are at the forefront of technological innovation and industry disruption can provide growth opportunities. Small-cap companies involved in emerging technologies and new market trends may offer significant upside potential.
- Monitor Economic Indicators: Staying informed about key economic indicators and policy changes can help investors make informed decisions. Understanding how these factors impact the Russell 2000 can aid in predicting potential market movements and adjusting investment strategies accordingly.
- Long-Term Perspective: While small-cap stocks can be volatile, maintaining a long-term perspective can help investors navigate short-term fluctuations and benefit from the overall growth potential of the Russell 2000.
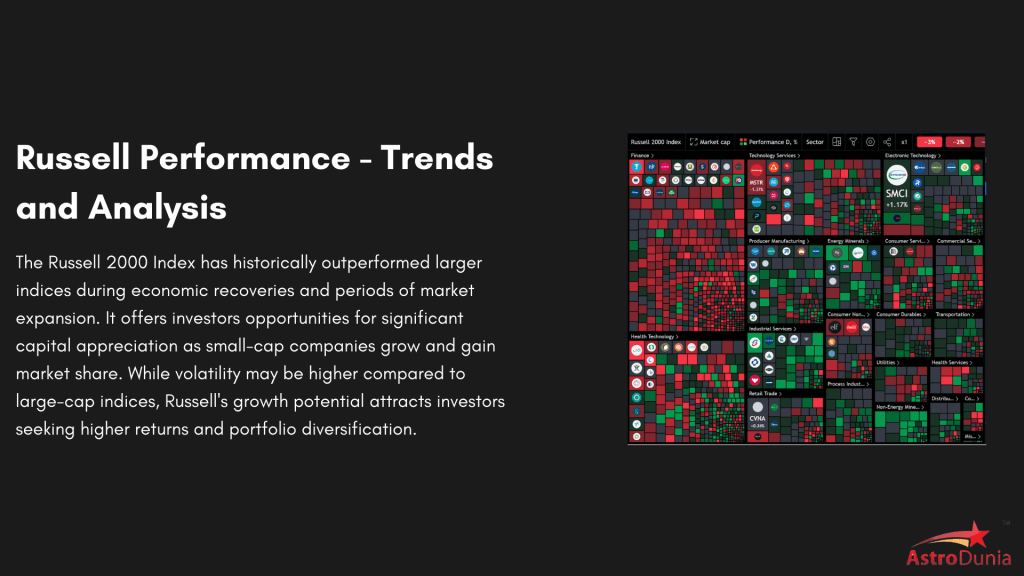
Top 20 Stocks in Russell
Uncover the top stocks in the Russell Index. Click on the links below for in-depth analysis and insights into the performance and trends of these leading stocks.
Russell 2000 Forecast for the Next 5 Years
Medium-term forecasts consider economic cycles, fiscal policies, and technological trends. The Russell 2000 is expected to grow over the next five years, driven by innovation and increased consumer spending, despite potential risks like geopolitical tensions and regulatory changes.
Want to stay long-term in the market?
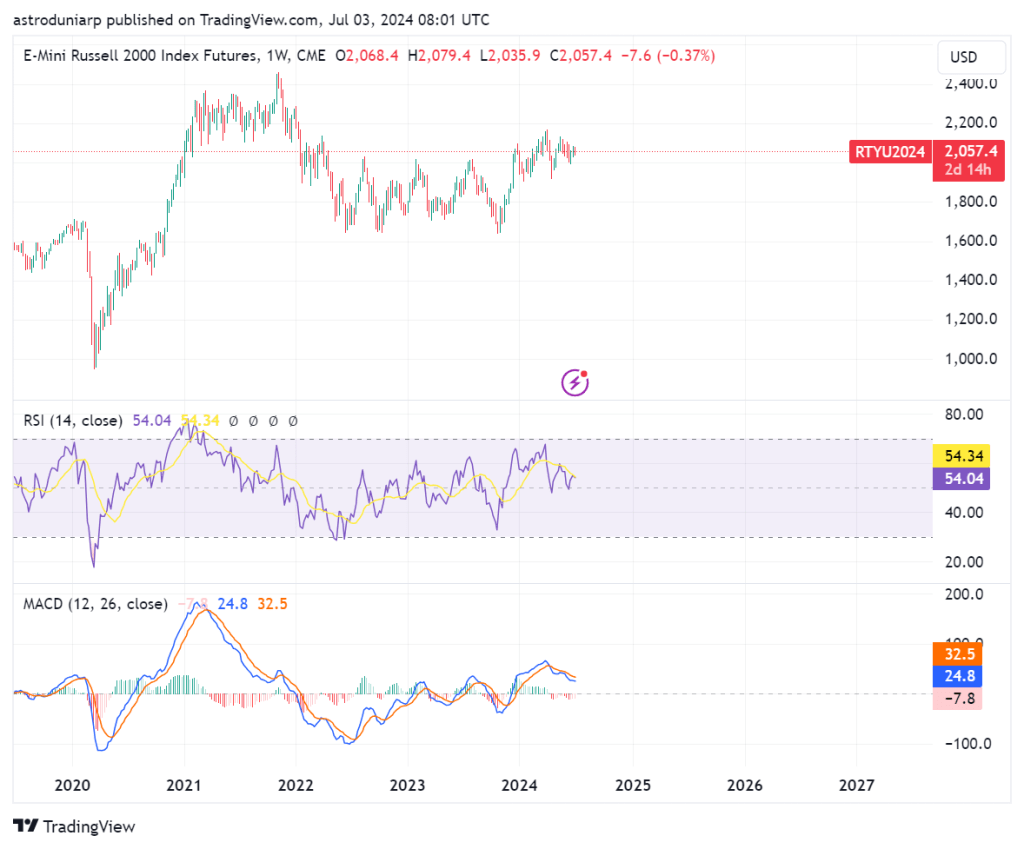
Chart displaying Russell index prices over a the Five years period
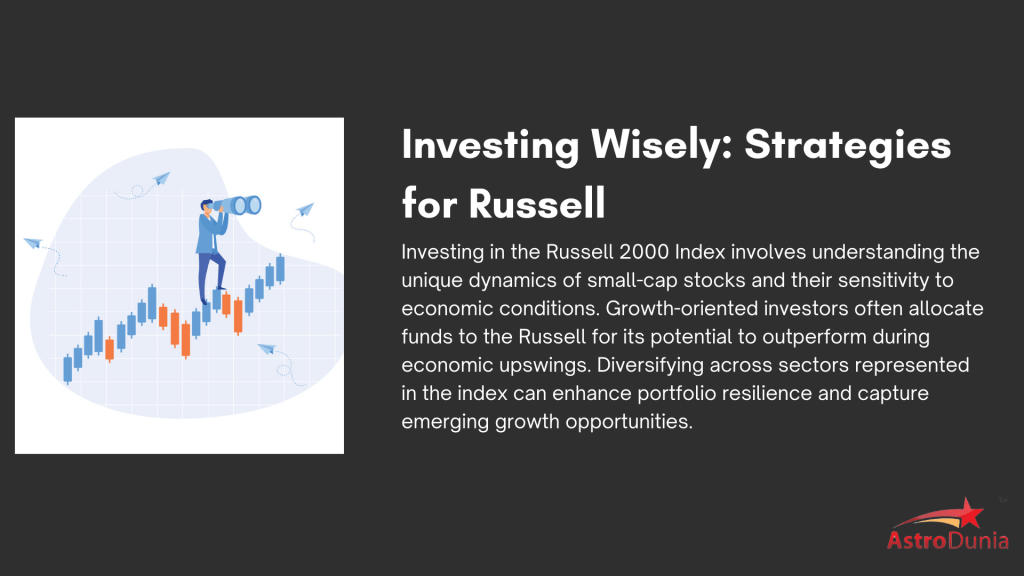
Live Trading Signals on Russell 2000
Stay ahead in the stock market with our comprehensive market alerts and live signals service. For More Information , you can contact us – +91 9669919000
Russell 2000 Index (Russell)
The Russell 2000 Index measures the performance of the 2,000 smallest companies in the Russell 3000 Index.
| No. | ETF Name | Symbol |
| 1. | iShares Russell 2000 ETF | IWM |
| 2. | Vanguard Russell 2000 ETF | VTWO |
| 3. | ProShares Ultra Russell2000 | UWM |
| 4. | Direxion Daily Small Cap Bull 3X Shares | TNA |
| 5. | SPDR Russell 2000 ETF | TWOK |
| 6. | ProShares Short Russell2000 | RWM |
| 7. | iShares Russell 2000 Growth ETF | IWO |
| 8. | iShares Russell 2000 Value ETF | IWN |
| 9. | WisdomTree U.S. SmallCap Dividend Fund | DES |
| 10. | iShares Russell 2000 High Dividend ETF | HYLD |
Conclusion
The Russell 2000 Index has evolved significantly since its inception, reflecting the dynamic nature of the U.S. stock market and the performance of small-cap companies. From its early challenges to its current status as a key benchmark for small-cap stocks, the Russell 2000 has demonstrated resilience and growth potential.
Looking to the future, the index is expected to continue playing a crucial role in assessing the performance of small-cap companies and providing insights into broader market trends. By understanding the historical context, current dynamics, and future prospects of the Russell 2000, investors can make informed decisions and strategically position themselves to capitalize on the opportunities presented by this vital index.

Whether you’re a seasoned investor or just starting out, our financial astrology tools can be tailored to your specific investment goals. Gain valuable insights to achieve your financial aspirations.
Address
1301, 13th Floor, Skye Corporate Park, Near Satya Sai Square, AB Road, Indore 452010
+91 9669919000
© All Rights Reserved by RajeevPrakash.com (Managed by AstroQ AI Private Limited) – 2025